Inupiat vs Bolivian In Labor Force | Age 35-44
COMPARE
Inupiat
Bolivian
In Labor Force | Age 35-44
In Labor Force | Age 35-44 Comparison
Inupiat
Bolivians
80.9%
IN LABOR FORCE | AGE 35-44
0.0/ 100
METRIC RATING
319th/ 347
METRIC RANK
86.1%
IN LABOR FORCE | AGE 35-44
100.0/ 100
METRIC RATING
6th/ 347
METRIC RANK
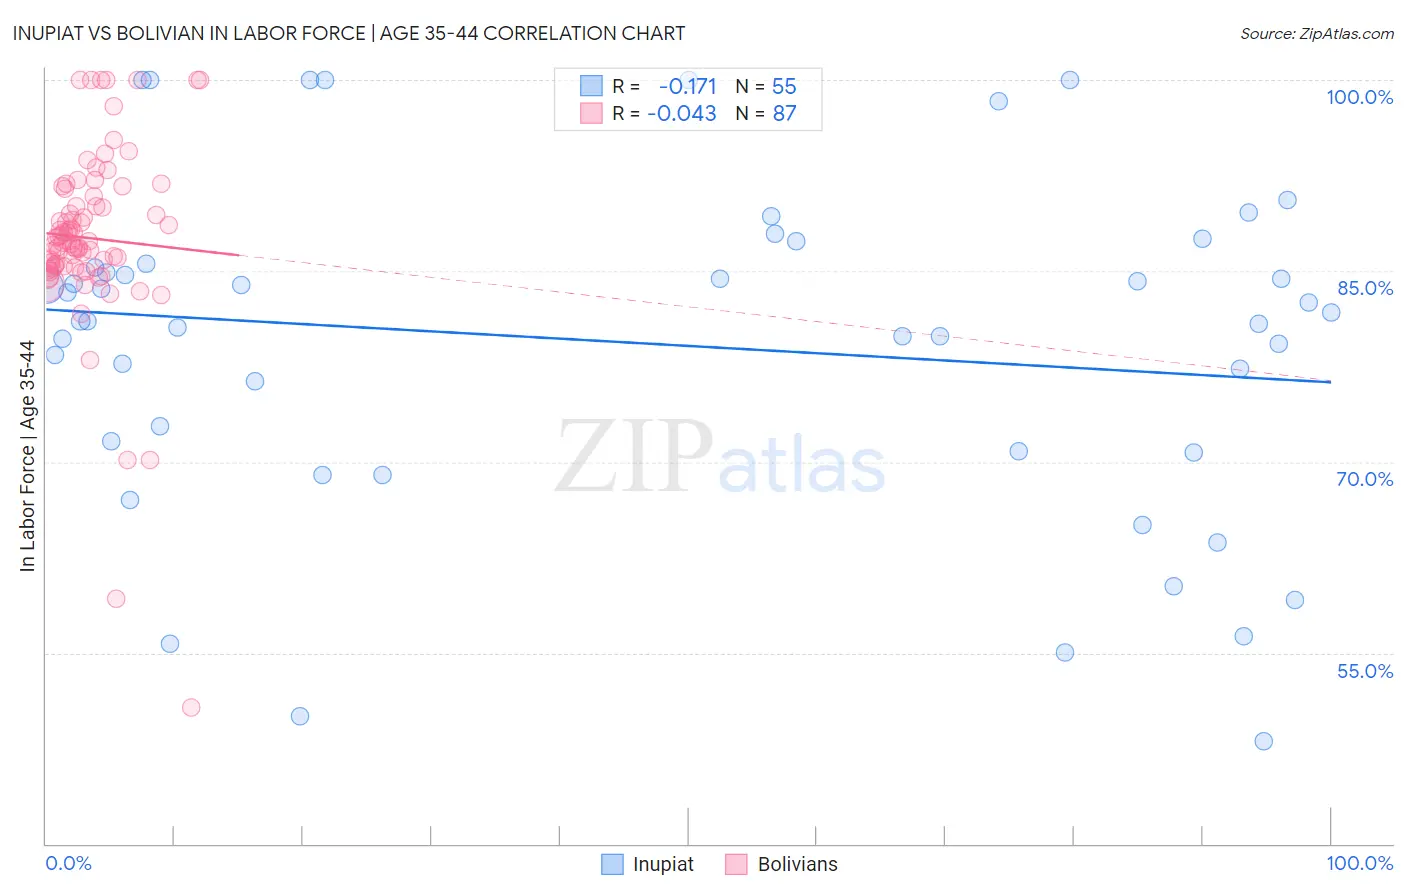
Inupiat vs Bolivian In Labor Force | Age 35-44 Correlation Chart
The statistical analysis conducted on geographies consisting of 96,340,693 people shows a poor negative correlation between the proportion of Inupiat and labor force participation rate among population between the ages 35 and 44 in the United States with a correlation coefficient (R) of -0.171 and weighted average of 80.9%. Similarly, the statistical analysis conducted on geographies consisting of 184,652,414 people shows no correlation between the proportion of Bolivians and labor force participation rate among population between the ages 35 and 44 in the United States with a correlation coefficient (R) of -0.043 and weighted average of 86.1%, a difference of 6.3%.
In Labor Force | Age 35-44 Correlation Summary
| Measurement | Inupiat | Bolivian |
| Minimum | 48.1% | 50.7% |
| Maximum | 100.0% | 100.0% |
| Range | 51.9% | 49.3% |
| Mean | 79.3% | 87.6% |
| Median | 81.1% | 87.3% |
| Interquartile 25% (IQ1) | 70.8% | 85.4% |
| Interquartile 75% (IQ3) | 85.5% | 90.9% |
| Interquartile Range (IQR) | 14.7% | 5.5% |
| Standard Deviation (Sample) | 13.0% | 7.4% |
| Standard Deviation (Population) | 12.9% | 7.4% |
Similar Demographics by In Labor Force | Age 35-44
Demographics Similar to Inupiat by In Labor Force | Age 35-44
In terms of in labor force | age 35-44, the demographic groups most similar to Inupiat are Chickasaw (80.9%, a difference of 0.050%), Puerto Rican (80.7%, a difference of 0.33%), Paiute (80.6%, a difference of 0.40%), Alaskan Athabascan (81.3%, a difference of 0.44%), and Yaqui (80.5%, a difference of 0.51%).
| Demographics | Rating | Rank | In Labor Force | Age 35-44 |
| Alaska Natives | 0.0 /100 | #312 | Tragic 81.6% |
| Mexicans | 0.0 /100 | #313 | Tragic 81.6% |
| Cajuns | 0.0 /100 | #314 | Tragic 81.5% |
| Immigrants | Mexico | 0.0 /100 | #315 | Tragic 81.5% |
| Comanche | 0.0 /100 | #316 | Tragic 81.5% |
| Cherokee | 0.0 /100 | #317 | Tragic 81.4% |
| Alaskan Athabascans | 0.0 /100 | #318 | Tragic 81.3% |
| Inupiat | 0.0 /100 | #319 | Tragic 80.9% |
| Chickasaw | 0.0 /100 | #320 | Tragic 80.9% |
| Puerto Ricans | 0.0 /100 | #321 | Tragic 80.7% |
| Paiute | 0.0 /100 | #322 | Tragic 80.6% |
| Yaqui | 0.0 /100 | #323 | Tragic 80.5% |
| Choctaw | 0.0 /100 | #324 | Tragic 80.5% |
| Dutch West Indians | 0.0 /100 | #325 | Tragic 80.4% |
| Seminole | 0.0 /100 | #326 | Tragic 80.4% |
Demographics Similar to Bolivians by In Labor Force | Age 35-44
In terms of in labor force | age 35-44, the demographic groups most similar to Bolivians are Zimbabwean (86.1%, a difference of 0.010%), Immigrants from Sierra Leone (86.1%, a difference of 0.040%), Immigrants from Cabo Verde (86.2%, a difference of 0.14%), Immigrants from Bolivia (86.2%, a difference of 0.17%), and Immigrants from Ethiopia (85.9%, a difference of 0.21%).
| Demographics | Rating | Rank | In Labor Force | Age 35-44 |
| Sierra Leoneans | 100.0 /100 | #1 | Exceptional 86.4% |
| Luxembourgers | 100.0 /100 | #2 | Exceptional 86.4% |
| Immigrants | Bolivia | 100.0 /100 | #3 | Exceptional 86.2% |
| Immigrants | Cabo Verde | 100.0 /100 | #4 | Exceptional 86.2% |
| Zimbabweans | 100.0 /100 | #5 | Exceptional 86.1% |
| Bolivians | 100.0 /100 | #6 | Exceptional 86.1% |
| Immigrants | Sierra Leone | 100.0 /100 | #7 | Exceptional 86.1% |
| Immigrants | Ethiopia | 100.0 /100 | #8 | Exceptional 85.9% |
| Ethiopians | 100.0 /100 | #9 | Exceptional 85.9% |
| Cape Verdeans | 100.0 /100 | #10 | Exceptional 85.8% |
| Immigrants | Cameroon | 100.0 /100 | #11 | Exceptional 85.8% |
| Liberians | 100.0 /100 | #12 | Exceptional 85.7% |
| Somalis | 100.0 /100 | #13 | Exceptional 85.6% |
| Immigrants | Somalia | 100.0 /100 | #14 | Exceptional 85.6% |
| Norwegians | 100.0 /100 | #15 | Exceptional 85.6% |