Inupiat vs Immigrants from Thailand In Labor Force | Age 35-44
COMPARE
Inupiat
Immigrants from Thailand
In Labor Force | Age 35-44
In Labor Force | Age 35-44 Comparison
Inupiat
Immigrants from Thailand
80.9%
IN LABOR FORCE | AGE 35-44
0.0/ 100
METRIC RATING
319th/ 347
METRIC RANK
84.0%
IN LABOR FORCE | AGE 35-44
4.7/ 100
METRIC RATING
229th/ 347
METRIC RANK
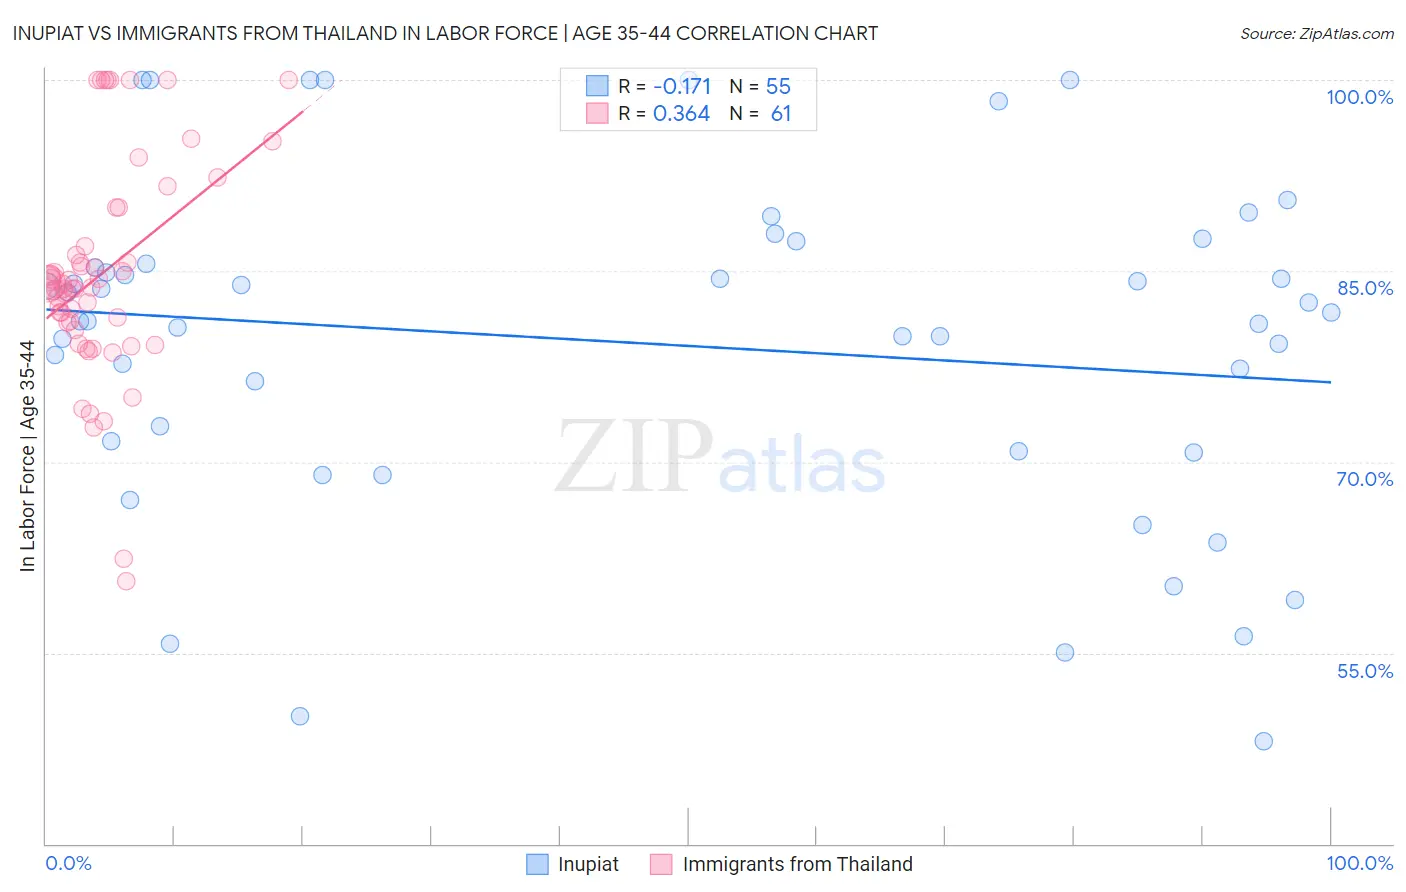
Inupiat vs Immigrants from Thailand In Labor Force | Age 35-44 Correlation Chart
The statistical analysis conducted on geographies consisting of 96,340,693 people shows a poor negative correlation between the proportion of Inupiat and labor force participation rate among population between the ages 35 and 44 in the United States with a correlation coefficient (R) of -0.171 and weighted average of 80.9%. Similarly, the statistical analysis conducted on geographies consisting of 316,952,991 people shows a mild positive correlation between the proportion of Immigrants from Thailand and labor force participation rate among population between the ages 35 and 44 in the United States with a correlation coefficient (R) of 0.364 and weighted average of 84.0%, a difference of 3.7%.
In Labor Force | Age 35-44 Correlation Summary
| Measurement | Inupiat | Immigrants from Thailand |
| Minimum | 48.1% | 60.6% |
| Maximum | 100.0% | 100.0% |
| Range | 51.9% | 39.4% |
| Mean | 79.3% | 84.7% |
| Median | 81.1% | 83.7% |
| Interquartile 25% (IQ1) | 70.8% | 80.6% |
| Interquartile 75% (IQ3) | 85.5% | 88.5% |
| Interquartile Range (IQR) | 14.7% | 7.8% |
| Standard Deviation (Sample) | 13.0% | 8.5% |
| Standard Deviation (Population) | 12.9% | 8.5% |
Similar Demographics by In Labor Force | Age 35-44
Demographics Similar to Inupiat by In Labor Force | Age 35-44
In terms of in labor force | age 35-44, the demographic groups most similar to Inupiat are Chickasaw (80.9%, a difference of 0.050%), Puerto Rican (80.7%, a difference of 0.33%), Paiute (80.6%, a difference of 0.40%), Alaskan Athabascan (81.3%, a difference of 0.44%), and Yaqui (80.5%, a difference of 0.51%).
| Demographics | Rating | Rank | In Labor Force | Age 35-44 |
| Alaska Natives | 0.0 /100 | #312 | Tragic 81.6% |
| Mexicans | 0.0 /100 | #313 | Tragic 81.6% |
| Cajuns | 0.0 /100 | #314 | Tragic 81.5% |
| Immigrants | Mexico | 0.0 /100 | #315 | Tragic 81.5% |
| Comanche | 0.0 /100 | #316 | Tragic 81.5% |
| Cherokee | 0.0 /100 | #317 | Tragic 81.4% |
| Alaskan Athabascans | 0.0 /100 | #318 | Tragic 81.3% |
| Inupiat | 0.0 /100 | #319 | Tragic 80.9% |
| Chickasaw | 0.0 /100 | #320 | Tragic 80.9% |
| Puerto Ricans | 0.0 /100 | #321 | Tragic 80.7% |
| Paiute | 0.0 /100 | #322 | Tragic 80.6% |
| Yaqui | 0.0 /100 | #323 | Tragic 80.5% |
| Choctaw | 0.0 /100 | #324 | Tragic 80.5% |
| Dutch West Indians | 0.0 /100 | #325 | Tragic 80.4% |
| Seminole | 0.0 /100 | #326 | Tragic 80.4% |
Demographics Similar to Immigrants from Thailand by In Labor Force | Age 35-44
In terms of in labor force | age 35-44, the demographic groups most similar to Immigrants from Thailand are British West Indian (84.0%, a difference of 0.020%), Welsh (84.0%, a difference of 0.020%), Panamanian (84.0%, a difference of 0.030%), Immigrants from Iraq (83.9%, a difference of 0.040%), and U.S. Virgin Islander (84.0%, a difference of 0.050%).
| Demographics | Rating | Rank | In Labor Force | Age 35-44 |
| Assyrians/Chaldeans/Syriacs | 6.6 /100 | #222 | Tragic 84.0% |
| Immigrants | Panama | 6.4 /100 | #223 | Tragic 84.0% |
| U.S. Virgin Islanders | 6.1 /100 | #224 | Tragic 84.0% |
| Immigrants | Burma/Myanmar | 6.1 /100 | #225 | Tragic 84.0% |
| Panamanians | 5.4 /100 | #226 | Tragic 84.0% |
| British West Indians | 5.3 /100 | #227 | Tragic 84.0% |
| Welsh | 5.3 /100 | #228 | Tragic 84.0% |
| Immigrants | Thailand | 4.7 /100 | #229 | Tragic 84.0% |
| Immigrants | Iraq | 3.7 /100 | #230 | Tragic 83.9% |
| Scottish | 3.2 /100 | #231 | Tragic 83.9% |
| Native Hawaiians | 3.0 /100 | #232 | Tragic 83.9% |
| Immigrants | Germany | 2.8 /100 | #233 | Tragic 83.9% |
| Immigrants | Oceania | 2.6 /100 | #234 | Tragic 83.9% |
| Immigrants | Syria | 2.5 /100 | #235 | Tragic 83.9% |
| West Indians | 2.4 /100 | #236 | Tragic 83.9% |