Inupiat vs Osage In Labor Force | Age 35-44
COMPARE
Inupiat
Osage
In Labor Force | Age 35-44
In Labor Force | Age 35-44 Comparison
Inupiat
Osage
80.9%
IN LABOR FORCE | AGE 35-44
0.0/ 100
METRIC RATING
319th/ 347
METRIC RANK
82.9%
IN LABOR FORCE | AGE 35-44
0.0/ 100
METRIC RATING
282nd/ 347
METRIC RANK
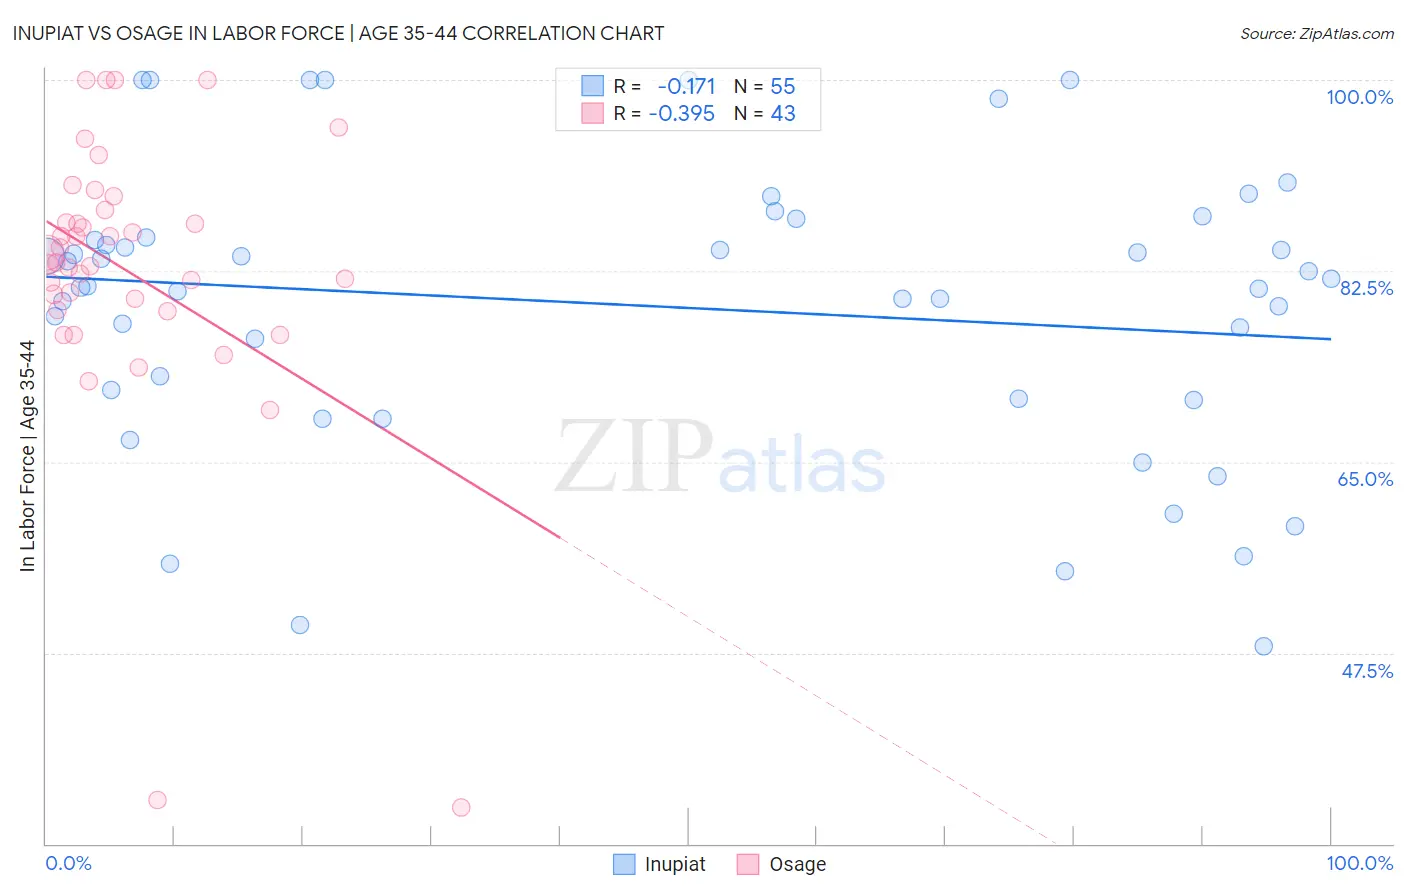
Inupiat vs Osage In Labor Force | Age 35-44 Correlation Chart
The statistical analysis conducted on geographies consisting of 96,340,693 people shows a poor negative correlation between the proportion of Inupiat and labor force participation rate among population between the ages 35 and 44 in the United States with a correlation coefficient (R) of -0.171 and weighted average of 80.9%. Similarly, the statistical analysis conducted on geographies consisting of 91,795,339 people shows a mild negative correlation between the proportion of Osage and labor force participation rate among population between the ages 35 and 44 in the United States with a correlation coefficient (R) of -0.395 and weighted average of 82.9%, a difference of 2.5%.
In Labor Force | Age 35-44 Correlation Summary
| Measurement | Inupiat | Osage |
| Minimum | 48.1% | 33.3% |
| Maximum | 100.0% | 100.0% |
| Range | 51.9% | 66.7% |
| Mean | 79.3% | 82.5% |
| Median | 81.1% | 83.3% |
| Interquartile 25% (IQ1) | 70.8% | 78.9% |
| Interquartile 75% (IQ3) | 85.5% | 88.1% |
| Interquartile Range (IQR) | 14.7% | 9.3% |
| Standard Deviation (Sample) | 13.0% | 13.2% |
| Standard Deviation (Population) | 12.9% | 13.0% |
Similar Demographics by In Labor Force | Age 35-44
Demographics Similar to Inupiat by In Labor Force | Age 35-44
In terms of in labor force | age 35-44, the demographic groups most similar to Inupiat are Chickasaw (80.9%, a difference of 0.050%), Puerto Rican (80.7%, a difference of 0.33%), Paiute (80.6%, a difference of 0.40%), Alaskan Athabascan (81.3%, a difference of 0.44%), and Yaqui (80.5%, a difference of 0.51%).
| Demographics | Rating | Rank | In Labor Force | Age 35-44 |
| Alaska Natives | 0.0 /100 | #312 | Tragic 81.6% |
| Mexicans | 0.0 /100 | #313 | Tragic 81.6% |
| Cajuns | 0.0 /100 | #314 | Tragic 81.5% |
| Immigrants | Mexico | 0.0 /100 | #315 | Tragic 81.5% |
| Comanche | 0.0 /100 | #316 | Tragic 81.5% |
| Cherokee | 0.0 /100 | #317 | Tragic 81.4% |
| Alaskan Athabascans | 0.0 /100 | #318 | Tragic 81.3% |
| Inupiat | 0.0 /100 | #319 | Tragic 80.9% |
| Chickasaw | 0.0 /100 | #320 | Tragic 80.9% |
| Puerto Ricans | 0.0 /100 | #321 | Tragic 80.7% |
| Paiute | 0.0 /100 | #322 | Tragic 80.6% |
| Yaqui | 0.0 /100 | #323 | Tragic 80.5% |
| Choctaw | 0.0 /100 | #324 | Tragic 80.5% |
| Dutch West Indians | 0.0 /100 | #325 | Tragic 80.4% |
| Seminole | 0.0 /100 | #326 | Tragic 80.4% |
Demographics Similar to Osage by In Labor Force | Age 35-44
In terms of in labor force | age 35-44, the demographic groups most similar to Osage are Immigrants from Guatemala (82.9%, a difference of 0.0%), Immigrants from Dominican Republic (82.9%, a difference of 0.010%), Fijian (82.9%, a difference of 0.020%), Immigrants from Bangladesh (82.9%, a difference of 0.020%), and Immigrants from Belize (82.9%, a difference of 0.030%).
| Demographics | Rating | Rank | In Labor Force | Age 35-44 |
| Hawaiians | 0.0 /100 | #275 | Tragic 83.2% |
| Delaware | 0.0 /100 | #276 | Tragic 83.2% |
| Samoans | 0.0 /100 | #277 | Tragic 83.2% |
| Belizeans | 0.0 /100 | #278 | Tragic 83.1% |
| Immigrants | Micronesia | 0.0 /100 | #279 | Tragic 83.1% |
| Dominicans | 0.0 /100 | #280 | Tragic 83.1% |
| Guatemalans | 0.0 /100 | #281 | Tragic 83.0% |
| Osage | 0.0 /100 | #282 | Tragic 82.9% |
| Immigrants | Guatemala | 0.0 /100 | #283 | Tragic 82.9% |
| Immigrants | Dominican Republic | 0.0 /100 | #284 | Tragic 82.9% |
| Fijians | 0.0 /100 | #285 | Tragic 82.9% |
| Immigrants | Bangladesh | 0.0 /100 | #286 | Tragic 82.9% |
| Immigrants | Belize | 0.0 /100 | #287 | Tragic 82.9% |
| Puget Sound Salish | 0.0 /100 | #288 | Tragic 82.9% |
| Chippewa | 0.0 /100 | #289 | Tragic 82.9% |