Panamanian vs Bolivian In Labor Force | Age 35-44

COMPARE

Panamanian
Race
Ancestry
AfghanAfricanAlaska NativeAlaskan AthabascanAlbanianAleutAlsatianAmericanApacheArabArapahoArgentineanArmenianAssyrian/Chaldean/SyriacAustralianAustrianBahamianBangladeshiBarbadianBasqueBelgianBelizeanBermudanBhutaneseBlackfeetBrazilianBritishBritish West IndianBulgarianBurmeseCajunCambodianCanadianCape VerdeanCarpatho RusynCelticCentral AmericanCentral American IndianCherokeeCheyenneChickasawChileanChineseChippewaChoctawColombianColvilleComancheCosta RicanCreeCreekCroatianCrowCubanCypriotCzechCzechoslovakianDanishDelawareDominicanDutchDutch West IndianEastern EuropeanEcuadorianEgyptianEnglishEstonianEthiopianEuropeanFijianFilipinoFinnishFrenchFrench American IndianFrench CanadianGermanGerman RussianGhanaianGreekGuamanian/ChamorroGuatemalanGuyaneseHaitianHmongHonduranHopiHoumaHungarianIcelanderIndian (Asian)IndonesianInupiatIranianIraqiIrishIroquoisIsraeliItalianJamaicanJapaneseJordanianKenyanKiowaKoreanLaotianLatvianLebaneseLiberianLithuanianLumbeeLuxembourgerMacedonianMalaysianMalteseMarshalleseMenomineeMexicanMexican American IndianMongolianMoroccanNative HawaiianNavajoNepaleseNew ZealanderNicaraguanNigerianNorthern EuropeanNorwegianOkinawanOsageOttawaPaiutePakistaniPalestinianPanamanianParaguayanPennsylvania GermanPeruvianPimaPolishPortuguesePotawatomiPuebloPuerto RicanPuget Sound SalishRomanianRussianSalvadoranSamoanScandinavianScotch-IrishScottishSeminoleSenegaleseSerbianShoshoneSierra LeoneanSiouxSlavicSlovakSloveneSomaliSouth AfricanSouth AmericanSouth American IndianSoviet UnionSpaniardSpanishSpanish AmericanSpanish American IndianSri LankanSubsaharan AfricanSudaneseSwedishSwissSyrianTaiwaneseThaiTlingit-HaidaTohono O'OdhamTonganTrinidadian and TobagonianTsimshianTurkishU.S. Virgin IslanderUgandanUkrainianUruguayanUteVenezuelanVietnameseWelshWest IndianYakamaYaquiYugoslavianYumanYup'ikZimbabwean
Immigration
NonimmigrantsImmigrantsAfghanistanAfricaAlbaniaArgentinaArmeniaAsiaAustraliaAustriaBahamasBangladeshBarbadosBelarusBelgiumBelizeBoliviaBosnia and HerzegovinaBrazilBulgariaBurma/MyanmarCabo VerdeCambodiaCameroonCanadaCaribbeanCentral AmericaChileChinaColombiaCongoCosta RicaCroatiaCubaCzechoslovakiaDenmarkDominicaDominican RepublicEastern AfricaEastern AsiaEastern EuropeEcuadorEgyptEl SalvadorEnglandEritreaEthiopiaEuropeFijiFranceGermanyGhanaGreeceGrenadaGuatemalaGuyanaHaitiHondurasHong KongHungaryIndiaIndonesiaIranIraqIrelandIsraelItalyJamaicaJapanJordanKazakhstanKenyaKoreaKuwaitLaosLatin AmericaLatviaLebanonLiberiaLithuaniaMalaysiaMexicoMicronesiaMiddle AfricaMoldovaMoroccoNepalNetherlandsNicaraguaNigeriaNorth AmericaNorth MacedoniaNorthern AfricaNorthern EuropeNorwayOceaniaPakistanPanamaPeruPhilippinesPolandPortugalRomaniaRussiaSaudi ArabiaScotlandSenegalSerbiaSierra LeoneSingaporeSomaliaSouth AfricaSouth AmericaSouth Central AsiaSouth Eastern AsiaSouthern EuropeSpainSri LankaSt. Vincent and the GrenadinesSudanSwedenSwitzerlandSyriaTaiwanThailandTrinidad and TobagoTurkeyUgandaUkraineUruguayUzbekistanVenezuelaVietnamWest IndiesWestern AfricaWestern AsiaWestern EuropeYemenZaireZimbabweAzores
Bolivian
Race
Ancestry
AfghanAfricanAlaska NativeAlaskan AthabascanAlbanianAleutAlsatianAmericanApacheArabArapahoArgentineanArmenianAssyrian/Chaldean/SyriacAustralianAustrianBahamianBangladeshiBarbadianBasqueBelgianBelizeanBermudanBhutaneseBlackfeetBolivianBrazilianBritishBritish West IndianBulgarianBurmeseCajunCambodianCanadianCape VerdeanCarpatho RusynCelticCentral AmericanCentral American IndianCherokeeCheyenneChickasawChileanChineseChippewaChoctawColombianColvilleComancheCosta RicanCreeCreekCroatianCrowCubanCypriotCzechCzechoslovakianDanishDelawareDominicanDutchDutch West IndianEastern EuropeanEcuadorianEgyptianEnglishEstonianEthiopianEuropeanFijianFilipinoFinnishFrenchFrench American IndianFrench CanadianGermanGerman RussianGhanaianGreekGuamanian/ChamorroGuatemalanGuyaneseHaitianHmongHonduranHopiHoumaHungarianIcelanderIndian (Asian)IndonesianInupiatIranianIraqiIrishIroquoisIsraeliItalianJamaicanJapaneseJordanianKenyanKiowaKoreanLaotianLatvianLebaneseLiberianLithuanianLumbeeLuxembourgerMacedonianMalaysianMalteseMarshalleseMenomineeMexicanMexican American IndianMongolianMoroccanNative HawaiianNavajoNepaleseNew ZealanderNicaraguanNigerianNorthern EuropeanNorwegianOkinawanOsageOttawaPaiutePakistaniPalestinianParaguayanPennsylvania GermanPeruvianPimaPolishPortuguesePotawatomiPuebloPuerto RicanPuget Sound SalishRomanianRussianSalvadoranSamoanScandinavianScotch-IrishScottishSeminoleSenegaleseSerbianShoshoneSierra LeoneanSiouxSlavicSlovakSloveneSomaliSouth AfricanSouth AmericanSouth American IndianSoviet UnionSpaniardSpanishSpanish AmericanSpanish American IndianSri LankanSubsaharan AfricanSudaneseSwedishSwissSyrianTaiwaneseThaiTlingit-HaidaTohono O'OdhamTonganTrinidadian and TobagonianTsimshianTurkishU.S. Virgin IslanderUgandanUkrainianUruguayanUteVenezuelanVietnameseWelshWest IndianYakamaYaquiYugoslavianYumanYup'ikZimbabwean
Immigration
NonimmigrantsImmigrantsAfghanistanAfricaAlbaniaArgentinaArmeniaAsiaAustraliaAustriaBahamasBangladeshBarbadosBelarusBelgiumBelizeBoliviaBosnia and HerzegovinaBrazilBulgariaBurma/MyanmarCabo VerdeCambodiaCameroonCanadaCaribbeanCentral AmericaChileChinaColombiaCongoCosta RicaCroatiaCubaCzechoslovakiaDenmarkDominicaDominican RepublicEastern AfricaEastern AsiaEastern EuropeEcuadorEgyptEl SalvadorEnglandEritreaEthiopiaEuropeFijiFranceGermanyGhanaGreeceGrenadaGuatemalaGuyanaHaitiHondurasHong KongHungaryIndiaIndonesiaIranIraqIrelandIsraelItalyJamaicaJapanJordanKazakhstanKenyaKoreaKuwaitLaosLatin AmericaLatviaLebanonLiberiaLithuaniaMalaysiaMexicoMicronesiaMiddle AfricaMoldovaMoroccoNepalNetherlandsNicaraguaNigeriaNorth AmericaNorth MacedoniaNorthern AfricaNorthern EuropeNorwayOceaniaPakistanPanamaPeruPhilippinesPolandPortugalRomaniaRussiaSaudi ArabiaScotlandSenegalSerbiaSierra LeoneSingaporeSomaliaSouth AfricaSouth AmericaSouth Central AsiaSouth Eastern AsiaSouthern EuropeSpainSri LankaSt. Vincent and the GrenadinesSudanSwedenSwitzerlandSyriaTaiwanThailandTrinidad and TobagoTurkeyUgandaUkraineUruguayUzbekistanVenezuelaVietnamWest IndiesWestern AfricaWestern AsiaWestern EuropeYemenZaireZimbabweAzores
In Labor Force | Age 35-44
Income
Poverty
Unemployment
Labor Participation
Family Structure
Vehicle Availability
Education Level
Disability

In Labor Force | Age 35-44 Comparison

Panamanians

Bolivians

Tragic
Exceptional
84.0%
IN LABOR FORCE | AGE 35-44
5.4/ 100
METRIC RATING
226th/ 347
METRIC RANK
86.1%
IN LABOR FORCE | AGE 35-44
100.0/ 100
METRIC RATING
6th/ 347
METRIC RANK

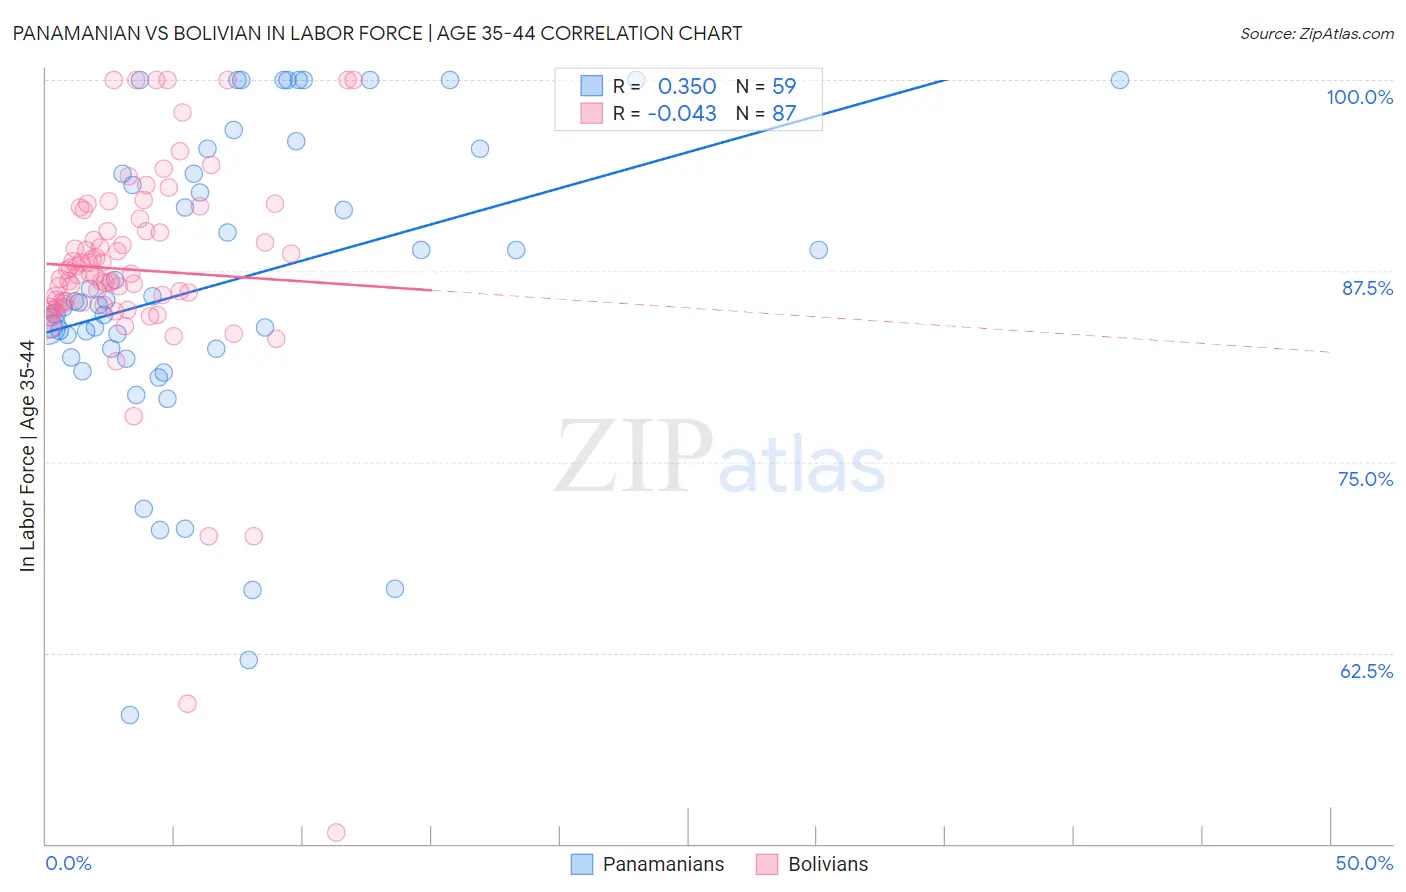
Panamanian vs Bolivian In Labor Force | Age 35-44 Correlation Chart

The statistical analysis conducted on geographies consisting of 281,116,157 people shows a mild positive correlation between the proportion of Panamanians and labor force participation rate among population between the ages 35 and 44 in the United States with a correlation coefficient (R) of 0.350 and weighted average of 84.0%. Similarly, the statistical analysis conducted on geographies consisting of 184,652,414 people shows no correlation between the proportion of Bolivians and labor force participation rate among population between the ages 35 and 44 in the United States with a correlation coefficient (R) of -0.043 and weighted average of 86.1%, a difference of 2.5%.
Panamanian vs Bolivian In Labor Force | Age 35-44

In Labor Force | Age 35-44 Correlation Summary

MeasurementPanamanianBolivian
Minimum58.4%50.7%
Maximum100.0%100.0%
Range41.6%49.3%
Mean86.7%87.6%
Median85.5%87.3%
Interquartile 25% (IQ1)82.4%85.4%
Interquartile 75% (IQ3)95.5%90.9%
Interquartile Range (IQR)13.1%5.5%
Standard Deviation (Sample)10.1%7.4%
Standard Deviation (Population)10.0%7.4%

Similar Demographics by In Labor Force | Age 35-44

Demographics Similar to Panamanians by In Labor Force | Age 35-44

In terms of in labor force | age 35-44, the demographic groups most similar to Panamanians are British West Indian (84.0%, a difference of 0.0%), Welsh (84.0%, a difference of 0.0%), U.S. Virgin Islander (84.0%, a difference of 0.020%), Immigrants from Burma/Myanmar (84.0%, a difference of 0.020%), and Assyrian/Chaldean/Syriac (84.0%, a difference of 0.030%).
DemographicsRating | RankIn Labor Force | Age 35-44
Sub-Saharan Africans
9.3
/100
|
#219
Tragic
84.1%
French
7.5
/100
|
#220
Tragic
84.0%
Icelanders
6.7
/100
|
#221
Tragic
84.0%
Assyrians/Chaldeans/Syriacs
6.6
/100
|
#222
Tragic
84.0%
Immigrants | Panama
6.4
/100
|
#223
Tragic
84.0%
U.S. Virgin Islanders
6.1
/100
|
#224
Tragic
84.0%
Immigrants | Burma/Myanmar
6.1
/100
|
#225
Tragic
84.0%
Panamanians
5.4
/100
|
#226
Tragic
84.0%
British West Indians
5.3
/100
|
#227
Tragic
84.0%
Welsh
5.3
/100
|
#228
Tragic
84.0%
Immigrants | Thailand
4.7
/100
|
#229
Tragic
84.0%
Immigrants | Iraq
3.7
/100
|
#230
Tragic
83.9%
Scottish
3.2
/100
|
#231
Tragic
83.9%
Native Hawaiians
3.0
/100
|
#232
Tragic
83.9%
Immigrants | Germany
2.8
/100
|
#233
Tragic
83.9%

Demographics Similar to Bolivians by In Labor Force | Age 35-44

In terms of in labor force | age 35-44, the demographic groups most similar to Bolivians are Zimbabwean (86.1%, a difference of 0.010%), Immigrants from Sierra Leone (86.1%, a difference of 0.040%), Immigrants from Cabo Verde (86.2%, a difference of 0.14%), Immigrants from Bolivia (86.2%, a difference of 0.17%), and Immigrants from Ethiopia (85.9%, a difference of 0.21%).
DemographicsRating | RankIn Labor Force | Age 35-44
Sierra Leoneans
100.0
/100
|
#1
Exceptional
86.4%
Luxembourgers
100.0
/100
|
#2
Exceptional
86.4%
Immigrants | Bolivia
100.0
/100
|
#3
Exceptional
86.2%
Immigrants | Cabo Verde
100.0
/100
|
#4
Exceptional
86.2%
Zimbabweans
100.0
/100
|
#5
Exceptional
86.1%
Bolivians
100.0
/100
|
#6
Exceptional
86.1%
Immigrants | Sierra Leone
100.0
/100
|
#7
Exceptional
86.1%
Immigrants | Ethiopia
100.0
/100
|
#8
Exceptional
85.9%
Ethiopians
100.0
/100
|
#9
Exceptional
85.9%
Cape Verdeans
100.0
/100
|
#10
Exceptional
85.8%
Immigrants | Cameroon
100.0
/100
|
#11
Exceptional
85.8%
Liberians
100.0
/100
|
#12
Exceptional
85.7%
Somalis
100.0
/100
|
#13
Exceptional
85.6%
Immigrants | Somalia
100.0
/100
|
#14
Exceptional
85.6%
Norwegians
100.0
/100
|
#15
Exceptional
85.6%