Cajun vs Bolivian In Labor Force | Age 35-44
COMPARE
Cajun
Bolivian
In Labor Force | Age 35-44
In Labor Force | Age 35-44 Comparison
Cajuns
Bolivians
81.5%
IN LABOR FORCE | AGE 35-44
0.0/ 100
METRIC RATING
314th/ 347
METRIC RANK
86.1%
IN LABOR FORCE | AGE 35-44
100.0/ 100
METRIC RATING
6th/ 347
METRIC RANK
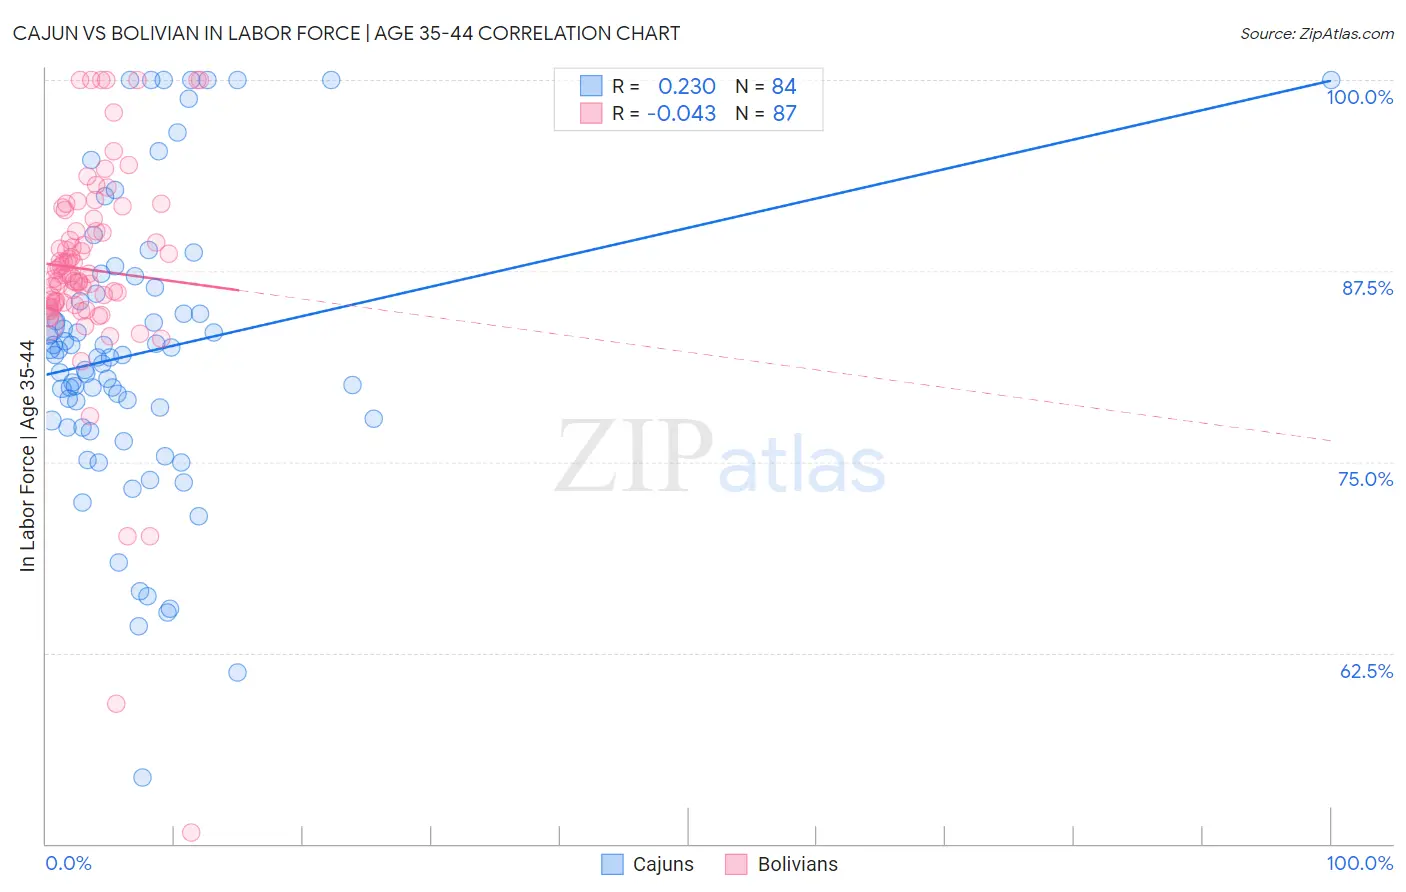
Cajun vs Bolivian In Labor Force | Age 35-44 Correlation Chart
The statistical analysis conducted on geographies consisting of 149,699,850 people shows a weak positive correlation between the proportion of Cajuns and labor force participation rate among population between the ages 35 and 44 in the United States with a correlation coefficient (R) of 0.230 and weighted average of 81.5%. Similarly, the statistical analysis conducted on geographies consisting of 184,652,414 people shows no correlation between the proportion of Bolivians and labor force participation rate among population between the ages 35 and 44 in the United States with a correlation coefficient (R) of -0.043 and weighted average of 86.1%, a difference of 5.6%.
In Labor Force | Age 35-44 Correlation Summary
| Measurement | Cajun | Bolivian |
| Minimum | 54.3% | 50.7% |
| Maximum | 100.0% | 100.0% |
| Range | 45.7% | 49.3% |
| Mean | 82.2% | 87.6% |
| Median | 81.9% | 87.3% |
| Interquartile 25% (IQ1) | 77.5% | 85.4% |
| Interquartile 75% (IQ3) | 86.2% | 90.9% |
| Interquartile Range (IQR) | 8.7% | 5.5% |
| Standard Deviation (Sample) | 9.5% | 7.4% |
| Standard Deviation (Population) | 9.5% | 7.4% |
Similar Demographics by In Labor Force | Age 35-44
Demographics Similar to Cajuns by In Labor Force | Age 35-44
In terms of in labor force | age 35-44, the demographic groups most similar to Cajuns are Immigrants from Mexico (81.5%, a difference of 0.020%), Comanche (81.5%, a difference of 0.050%), Mexican (81.6%, a difference of 0.11%), Alaska Native (81.6%, a difference of 0.12%), and Cherokee (81.4%, a difference of 0.13%).
| Demographics | Rating | Rank | In Labor Force | Age 35-44 |
| Hispanics or Latinos | 0.0 /100 | #307 | Tragic 82.1% |
| Immigrants | Central America | 0.0 /100 | #308 | Tragic 82.0% |
| Cree | 0.0 /100 | #309 | Tragic 82.0% |
| Blackfeet | 0.0 /100 | #310 | Tragic 81.9% |
| Colville | 0.0 /100 | #311 | Tragic 81.7% |
| Alaska Natives | 0.0 /100 | #312 | Tragic 81.6% |
| Mexicans | 0.0 /100 | #313 | Tragic 81.6% |
| Cajuns | 0.0 /100 | #314 | Tragic 81.5% |
| Immigrants | Mexico | 0.0 /100 | #315 | Tragic 81.5% |
| Comanche | 0.0 /100 | #316 | Tragic 81.5% |
| Cherokee | 0.0 /100 | #317 | Tragic 81.4% |
| Alaskan Athabascans | 0.0 /100 | #318 | Tragic 81.3% |
| Inupiat | 0.0 /100 | #319 | Tragic 80.9% |
| Chickasaw | 0.0 /100 | #320 | Tragic 80.9% |
| Puerto Ricans | 0.0 /100 | #321 | Tragic 80.7% |
Demographics Similar to Bolivians by In Labor Force | Age 35-44
In terms of in labor force | age 35-44, the demographic groups most similar to Bolivians are Zimbabwean (86.1%, a difference of 0.010%), Immigrants from Sierra Leone (86.1%, a difference of 0.040%), Immigrants from Cabo Verde (86.2%, a difference of 0.14%), Immigrants from Bolivia (86.2%, a difference of 0.17%), and Immigrants from Ethiopia (85.9%, a difference of 0.21%).
| Demographics | Rating | Rank | In Labor Force | Age 35-44 |
| Sierra Leoneans | 100.0 /100 | #1 | Exceptional 86.4% |
| Luxembourgers | 100.0 /100 | #2 | Exceptional 86.4% |
| Immigrants | Bolivia | 100.0 /100 | #3 | Exceptional 86.2% |
| Immigrants | Cabo Verde | 100.0 /100 | #4 | Exceptional 86.2% |
| Zimbabweans | 100.0 /100 | #5 | Exceptional 86.1% |
| Bolivians | 100.0 /100 | #6 | Exceptional 86.1% |
| Immigrants | Sierra Leone | 100.0 /100 | #7 | Exceptional 86.1% |
| Immigrants | Ethiopia | 100.0 /100 | #8 | Exceptional 85.9% |
| Ethiopians | 100.0 /100 | #9 | Exceptional 85.9% |
| Cape Verdeans | 100.0 /100 | #10 | Exceptional 85.8% |
| Immigrants | Cameroon | 100.0 /100 | #11 | Exceptional 85.8% |
| Liberians | 100.0 /100 | #12 | Exceptional 85.7% |
| Somalis | 100.0 /100 | #13 | Exceptional 85.6% |
| Immigrants | Somalia | 100.0 /100 | #14 | Exceptional 85.6% |
| Norwegians | 100.0 /100 | #15 | Exceptional 85.6% |