Jamaican vs Bolivian In Labor Force | Age 35-44
COMPARE
Jamaican
Bolivian
In Labor Force | Age 35-44
In Labor Force | Age 35-44 Comparison
Jamaicans
Bolivians
84.4%
IN LABOR FORCE | AGE 35-44
62.7/ 100
METRIC RATING
158th/ 347
METRIC RANK
86.1%
IN LABOR FORCE | AGE 35-44
100.0/ 100
METRIC RATING
6th/ 347
METRIC RANK
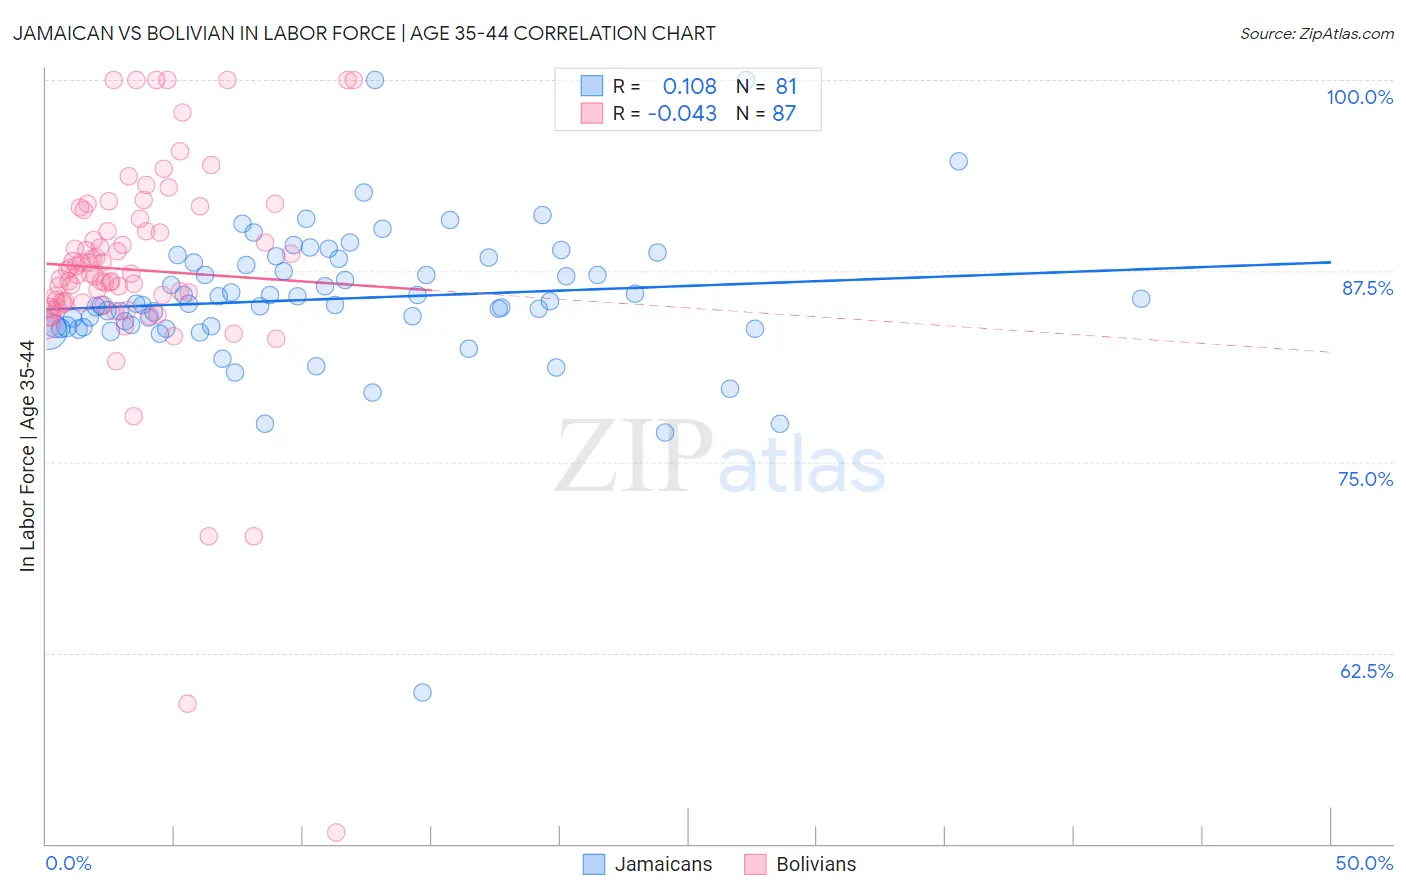
Jamaican vs Bolivian In Labor Force | Age 35-44 Correlation Chart
The statistical analysis conducted on geographies consisting of 367,727,365 people shows a poor positive correlation between the proportion of Jamaicans and labor force participation rate among population between the ages 35 and 44 in the United States with a correlation coefficient (R) of 0.108 and weighted average of 84.4%. Similarly, the statistical analysis conducted on geographies consisting of 184,652,414 people shows no correlation between the proportion of Bolivians and labor force participation rate among population between the ages 35 and 44 in the United States with a correlation coefficient (R) of -0.043 and weighted average of 86.1%, a difference of 1.9%.
In Labor Force | Age 35-44 Correlation Summary
| Measurement | Jamaican | Bolivian |
| Minimum | 59.9% | 50.7% |
| Maximum | 100.0% | 100.0% |
| Range | 40.1% | 49.3% |
| Mean | 85.7% | 87.6% |
| Median | 85.4% | 87.3% |
| Interquartile 25% (IQ1) | 83.8% | 85.4% |
| Interquartile 75% (IQ3) | 88.2% | 90.9% |
| Interquartile Range (IQR) | 4.3% | 5.5% |
| Standard Deviation (Sample) | 4.9% | 7.4% |
| Standard Deviation (Population) | 4.9% | 7.4% |
Similar Demographics by In Labor Force | Age 35-44
Demographics Similar to Jamaicans by In Labor Force | Age 35-44
In terms of in labor force | age 35-44, the demographic groups most similar to Jamaicans are Immigrants from Israel (84.4%, a difference of 0.010%), Immigrants from Austria (84.4%, a difference of 0.010%), Immigrants from Switzerland (84.5%, a difference of 0.020%), Immigrants from Senegal (84.4%, a difference of 0.020%), and Immigrants from Kazakhstan (84.4%, a difference of 0.020%).
| Demographics | Rating | Rank | In Labor Force | Age 35-44 |
| Romanians | 72.1 /100 | #151 | Good 84.5% |
| Immigrants | Taiwan | 71.4 /100 | #152 | Good 84.5% |
| Trinidadians and Tobagonians | 69.5 /100 | #153 | Good 84.5% |
| Iranians | 69.4 /100 | #154 | Good 84.5% |
| Immigrants | Switzerland | 65.9 /100 | #155 | Good 84.5% |
| Immigrants | Israel | 64.3 /100 | #156 | Good 84.4% |
| Immigrants | Austria | 63.8 /100 | #157 | Good 84.4% |
| Jamaicans | 62.7 /100 | #158 | Good 84.4% |
| Immigrants | Senegal | 60.4 /100 | #159 | Good 84.4% |
| Immigrants | Kazakhstan | 60.4 /100 | #160 | Good 84.4% |
| Immigrants | Venezuela | 60.0 /100 | #161 | Good 84.4% |
| Immigrants | Hungary | 59.4 /100 | #162 | Average 84.4% |
| Aleuts | 59.1 /100 | #163 | Average 84.4% |
| Nigerians | 58.9 /100 | #164 | Average 84.4% |
| Venezuelans | 58.1 /100 | #165 | Average 84.4% |
Demographics Similar to Bolivians by In Labor Force | Age 35-44
In terms of in labor force | age 35-44, the demographic groups most similar to Bolivians are Zimbabwean (86.1%, a difference of 0.010%), Immigrants from Sierra Leone (86.1%, a difference of 0.040%), Immigrants from Cabo Verde (86.2%, a difference of 0.14%), Immigrants from Bolivia (86.2%, a difference of 0.17%), and Immigrants from Ethiopia (85.9%, a difference of 0.21%).
| Demographics | Rating | Rank | In Labor Force | Age 35-44 |
| Sierra Leoneans | 100.0 /100 | #1 | Exceptional 86.4% |
| Luxembourgers | 100.0 /100 | #2 | Exceptional 86.4% |
| Immigrants | Bolivia | 100.0 /100 | #3 | Exceptional 86.2% |
| Immigrants | Cabo Verde | 100.0 /100 | #4 | Exceptional 86.2% |
| Zimbabweans | 100.0 /100 | #5 | Exceptional 86.1% |
| Bolivians | 100.0 /100 | #6 | Exceptional 86.1% |
| Immigrants | Sierra Leone | 100.0 /100 | #7 | Exceptional 86.1% |
| Immigrants | Ethiopia | 100.0 /100 | #8 | Exceptional 85.9% |
| Ethiopians | 100.0 /100 | #9 | Exceptional 85.9% |
| Cape Verdeans | 100.0 /100 | #10 | Exceptional 85.8% |
| Immigrants | Cameroon | 100.0 /100 | #11 | Exceptional 85.8% |
| Liberians | 100.0 /100 | #12 | Exceptional 85.7% |
| Somalis | 100.0 /100 | #13 | Exceptional 85.6% |
| Immigrants | Somalia | 100.0 /100 | #14 | Exceptional 85.6% |
| Norwegians | 100.0 /100 | #15 | Exceptional 85.6% |