Indian (Asian) vs Puget Sound Salish In Labor Force | Age 16-19
COMPARE
Indian (Asian)
Puget Sound Salish
In Labor Force | Age 16-19
In Labor Force | Age 16-19 Comparison
Indians (Asian)
Puget Sound Salish
31.9%
IN LABOR FORCE | AGE 16-19
0.0/ 100
METRIC RATING
311th/ 347
METRIC RANK
39.1%
IN LABOR FORCE | AGE 16-19
99.6/ 100
METRIC RATING
88th/ 347
METRIC RANK
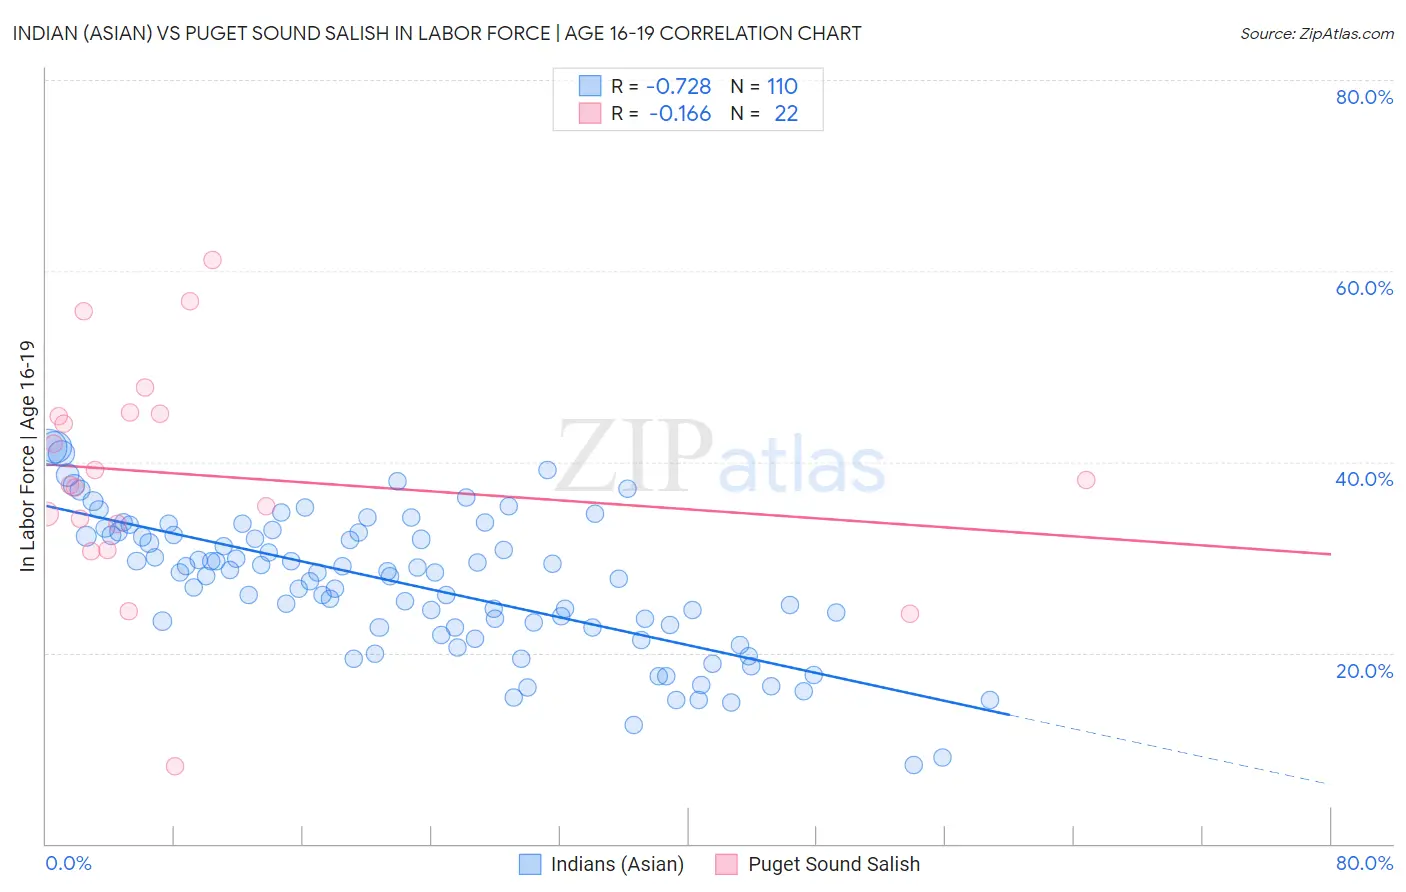
Indian (Asian) vs Puget Sound Salish In Labor Force | Age 16-19 Correlation Chart
The statistical analysis conducted on geographies consisting of 494,104,019 people shows a strong negative correlation between the proportion of Indians (Asian) and labor force participation rate among population between the ages 16 and 19 in the United States with a correlation coefficient (R) of -0.728 and weighted average of 31.9%. Similarly, the statistical analysis conducted on geographies consisting of 46,131,142 people shows a poor negative correlation between the proportion of Puget Sound Salish and labor force participation rate among population between the ages 16 and 19 in the United States with a correlation coefficient (R) of -0.166 and weighted average of 39.1%, a difference of 22.7%.
In Labor Force | Age 16-19 Correlation Summary
| Measurement | Indian (Asian) | Puget Sound Salish |
| Minimum | 8.3% | 8.1% |
| Maximum | 41.5% | 61.2% |
| Range | 33.2% | 53.1% |
| Mean | 27.1% | 38.6% |
| Median | 28.4% | 37.8% |
| Interquartile 25% (IQ1) | 22.7% | 33.5% |
| Interquartile 75% (IQ3) | 32.3% | 45.0% |
| Interquartile Range (IQR) | 9.7% | 11.5% |
| Standard Deviation (Sample) | 7.2% | 11.8% |
| Standard Deviation (Population) | 7.2% | 11.5% |
Similar Demographics by In Labor Force | Age 16-19
Demographics Similar to Indians (Asian) by In Labor Force | Age 16-19
In terms of in labor force | age 16-19, the demographic groups most similar to Indians (Asian) are Immigrants from Belize (31.8%, a difference of 0.14%), Hopi (31.8%, a difference of 0.15%), Cuban (31.8%, a difference of 0.31%), Immigrants from Iran (32.0%, a difference of 0.37%), and Immigrants from West Indies (31.7%, a difference of 0.49%).
| Demographics | Rating | Rank | In Labor Force | Age 16-19 |
| Israelis | 0.0 /100 | #304 | Tragic 32.4% |
| Nicaraguans | 0.0 /100 | #305 | Tragic 32.4% |
| Spanish American Indians | 0.0 /100 | #306 | Tragic 32.4% |
| Immigrants | Jamaica | 0.0 /100 | #307 | Tragic 32.2% |
| Navajo | 0.0 /100 | #308 | Tragic 32.1% |
| Immigrants | Eastern Asia | 0.0 /100 | #309 | Tragic 32.0% |
| Immigrants | Iran | 0.0 /100 | #310 | Tragic 32.0% |
| Indians (Asian) | 0.0 /100 | #311 | Tragic 31.9% |
| Immigrants | Belize | 0.0 /100 | #312 | Tragic 31.8% |
| Hopi | 0.0 /100 | #313 | Tragic 31.8% |
| Cubans | 0.0 /100 | #314 | Tragic 31.8% |
| Immigrants | West Indies | 0.0 /100 | #315 | Tragic 31.7% |
| Filipinos | 0.0 /100 | #316 | Tragic 31.7% |
| Immigrants | Nicaragua | 0.0 /100 | #317 | Tragic 31.6% |
| Immigrants | Yemen | 0.0 /100 | #318 | Tragic 31.5% |
Demographics Similar to Puget Sound Salish by In Labor Force | Age 16-19
In terms of in labor force | age 16-19, the demographic groups most similar to Puget Sound Salish are Alaska Native (39.1%, a difference of 0.010%), Immigrants from Germany (39.1%, a difference of 0.070%), Immigrants from Burma/Myanmar (39.0%, a difference of 0.090%), Samoan (39.1%, a difference of 0.16%), and Creek (39.1%, a difference of 0.17%).
| Demographics | Rating | Rank | In Labor Force | Age 16-19 |
| Shoshone | 99.7 /100 | #81 | Exceptional 39.3% |
| Basques | 99.7 /100 | #82 | Exceptional 39.3% |
| Spanish | 99.7 /100 | #83 | Exceptional 39.3% |
| Immigrants | Uganda | 99.7 /100 | #84 | Exceptional 39.2% |
| Creek | 99.6 /100 | #85 | Exceptional 39.1% |
| Samoans | 99.6 /100 | #86 | Exceptional 39.1% |
| Immigrants | Germany | 99.6 /100 | #87 | Exceptional 39.1% |
| Puget Sound Salish | 99.6 /100 | #88 | Exceptional 39.1% |
| Alaska Natives | 99.6 /100 | #89 | Exceptional 39.1% |
| Immigrants | Burma/Myanmar | 99.5 /100 | #90 | Exceptional 39.0% |
| Spanish Americans | 99.5 /100 | #91 | Exceptional 39.0% |
| Osage | 99.4 /100 | #92 | Exceptional 39.0% |
| Blackfeet | 99.4 /100 | #93 | Exceptional 38.9% |
| Immigrants | Canada | 99.4 /100 | #94 | Exceptional 38.9% |
| Immigrants | North America | 99.4 /100 | #95 | Exceptional 38.9% |