Indian (Asian) vs Ukrainian In Labor Force | Age 16-19
COMPARE
Indian (Asian)
Ukrainian
In Labor Force | Age 16-19
In Labor Force | Age 16-19 Comparison
Indians (Asian)
Ukrainians
31.9%
IN LABOR FORCE | AGE 16-19
0.0/ 100
METRIC RATING
311th/ 347
METRIC RANK
38.3%
IN LABOR FORCE | AGE 16-19
97.6/ 100
METRIC RATING
120th/ 347
METRIC RANK
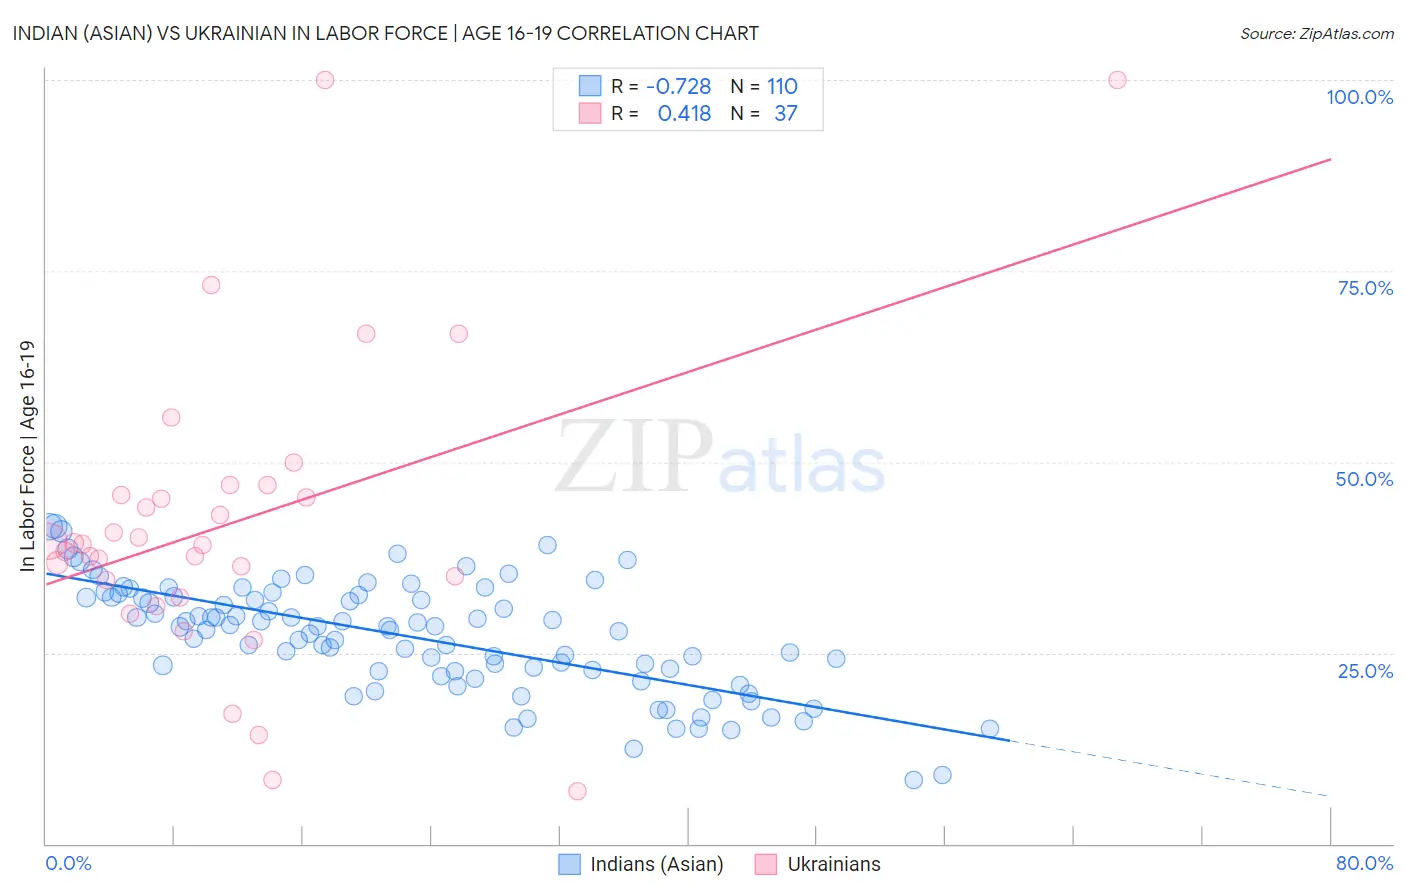
Indian (Asian) vs Ukrainian In Labor Force | Age 16-19 Correlation Chart
The statistical analysis conducted on geographies consisting of 494,104,019 people shows a strong negative correlation between the proportion of Indians (Asian) and labor force participation rate among population between the ages 16 and 19 in the United States with a correlation coefficient (R) of -0.728 and weighted average of 31.9%. Similarly, the statistical analysis conducted on geographies consisting of 447,440,014 people shows a moderate positive correlation between the proportion of Ukrainians and labor force participation rate among population between the ages 16 and 19 in the United States with a correlation coefficient (R) of 0.418 and weighted average of 38.3%, a difference of 20.2%.
In Labor Force | Age 16-19 Correlation Summary
| Measurement | Indian (Asian) | Ukrainian |
| Minimum | 8.3% | 6.9% |
| Maximum | 41.5% | 100.0% |
| Range | 33.2% | 93.1% |
| Mean | 27.1% | 42.0% |
| Median | 28.4% | 39.2% |
| Interquartile 25% (IQ1) | 22.7% | 33.4% |
| Interquartile 75% (IQ3) | 32.3% | 46.3% |
| Interquartile Range (IQR) | 9.7% | 12.9% |
| Standard Deviation (Sample) | 7.2% | 19.8% |
| Standard Deviation (Population) | 7.2% | 19.5% |
Similar Demographics by In Labor Force | Age 16-19
Demographics Similar to Indians (Asian) by In Labor Force | Age 16-19
In terms of in labor force | age 16-19, the demographic groups most similar to Indians (Asian) are Immigrants from Belize (31.8%, a difference of 0.14%), Hopi (31.8%, a difference of 0.15%), Cuban (31.8%, a difference of 0.31%), Immigrants from Iran (32.0%, a difference of 0.37%), and Immigrants from West Indies (31.7%, a difference of 0.49%).
| Demographics | Rating | Rank | In Labor Force | Age 16-19 |
| Israelis | 0.0 /100 | #304 | Tragic 32.4% |
| Nicaraguans | 0.0 /100 | #305 | Tragic 32.4% |
| Spanish American Indians | 0.0 /100 | #306 | Tragic 32.4% |
| Immigrants | Jamaica | 0.0 /100 | #307 | Tragic 32.2% |
| Navajo | 0.0 /100 | #308 | Tragic 32.1% |
| Immigrants | Eastern Asia | 0.0 /100 | #309 | Tragic 32.0% |
| Immigrants | Iran | 0.0 /100 | #310 | Tragic 32.0% |
| Indians (Asian) | 0.0 /100 | #311 | Tragic 31.9% |
| Immigrants | Belize | 0.0 /100 | #312 | Tragic 31.8% |
| Hopi | 0.0 /100 | #313 | Tragic 31.8% |
| Cubans | 0.0 /100 | #314 | Tragic 31.8% |
| Immigrants | West Indies | 0.0 /100 | #315 | Tragic 31.7% |
| Filipinos | 0.0 /100 | #316 | Tragic 31.7% |
| Immigrants | Nicaragua | 0.0 /100 | #317 | Tragic 31.6% |
| Immigrants | Yemen | 0.0 /100 | #318 | Tragic 31.5% |
Demographics Similar to Ukrainians by In Labor Force | Age 16-19
In terms of in labor force | age 16-19, the demographic groups most similar to Ukrainians are Assyrian/Chaldean/Syriac (38.3%, a difference of 0.090%), Immigrants from Nepal (38.3%, a difference of 0.10%), Chickasaw (38.3%, a difference of 0.11%), Ethiopian (38.2%, a difference of 0.11%), and Guamanian/Chamorro (38.2%, a difference of 0.13%).
| Demographics | Rating | Rank | In Labor Force | Age 16-19 |
| Sub-Saharan Africans | 98.3 /100 | #113 | Exceptional 38.4% |
| Hawaiians | 98.2 /100 | #114 | Exceptional 38.4% |
| Bulgarians | 97.9 /100 | #115 | Exceptional 38.3% |
| Colville | 97.9 /100 | #116 | Exceptional 38.3% |
| Chickasaw | 97.8 /100 | #117 | Exceptional 38.3% |
| Immigrants | Nepal | 97.8 /100 | #118 | Exceptional 38.3% |
| Assyrians/Chaldeans/Syriacs | 97.8 /100 | #119 | Exceptional 38.3% |
| Ukrainians | 97.6 /100 | #120 | Exceptional 38.3% |
| Ethiopians | 97.4 /100 | #121 | Exceptional 38.2% |
| Guamanians/Chamorros | 97.4 /100 | #122 | Exceptional 38.2% |
| Seminole | 96.7 /100 | #123 | Exceptional 38.1% |
| Immigrants | England | 96.4 /100 | #124 | Exceptional 38.1% |
| Immigrants | Africa | 96.1 /100 | #125 | Exceptional 38.0% |
| Africans | 95.6 /100 | #126 | Exceptional 38.0% |
| Choctaw | 95.6 /100 | #127 | Exceptional 38.0% |