Salvadoran vs Puget Sound Salish In Labor Force | Age 16-19
COMPARE
Salvadoran
Puget Sound Salish
In Labor Force | Age 16-19
In Labor Force | Age 16-19 Comparison
Salvadorans
Puget Sound Salish
34.5%
IN LABOR FORCE | AGE 16-19
1.1/ 100
METRIC RATING
261st/ 347
METRIC RANK
39.1%
IN LABOR FORCE | AGE 16-19
99.6/ 100
METRIC RATING
88th/ 347
METRIC RANK
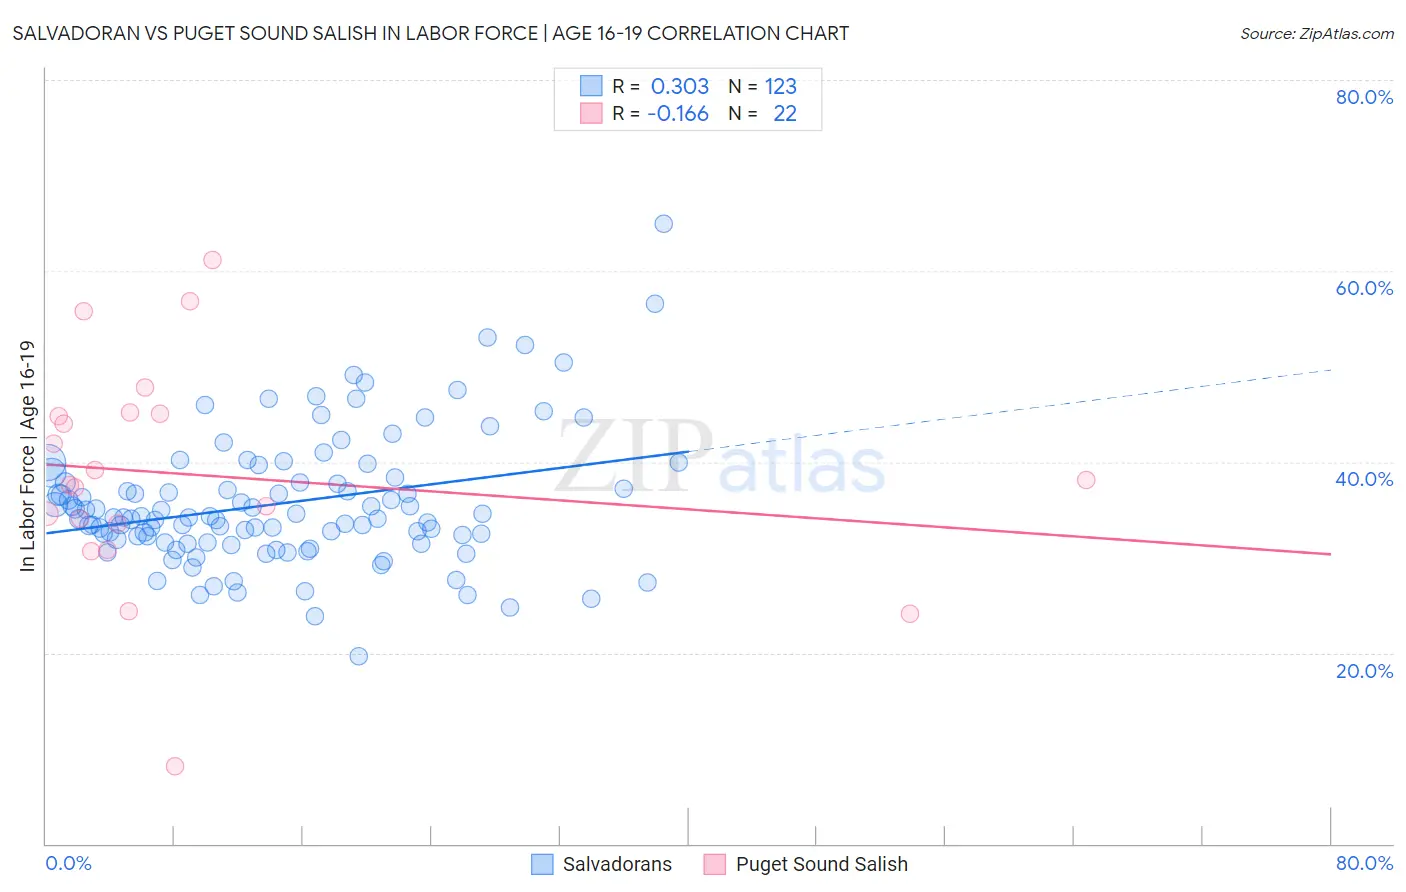
Salvadoran vs Puget Sound Salish In Labor Force | Age 16-19 Correlation Chart
The statistical analysis conducted on geographies consisting of 398,452,948 people shows a mild positive correlation between the proportion of Salvadorans and labor force participation rate among population between the ages 16 and 19 in the United States with a correlation coefficient (R) of 0.303 and weighted average of 34.5%. Similarly, the statistical analysis conducted on geographies consisting of 46,131,142 people shows a poor negative correlation between the proportion of Puget Sound Salish and labor force participation rate among population between the ages 16 and 19 in the United States with a correlation coefficient (R) of -0.166 and weighted average of 39.1%, a difference of 13.3%.
In Labor Force | Age 16-19 Correlation Summary
| Measurement | Salvadoran | Puget Sound Salish |
| Minimum | 19.7% | 8.1% |
| Maximum | 65.0% | 61.2% |
| Range | 45.3% | 53.1% |
| Mean | 35.6% | 38.6% |
| Median | 34.2% | 37.8% |
| Interquartile 25% (IQ1) | 31.6% | 33.5% |
| Interquartile 75% (IQ3) | 37.9% | 45.0% |
| Interquartile Range (IQR) | 6.3% | 11.5% |
| Standard Deviation (Sample) | 6.9% | 11.8% |
| Standard Deviation (Population) | 6.9% | 11.5% |
Similar Demographics by In Labor Force | Age 16-19
Demographics Similar to Salvadorans by In Labor Force | Age 16-19
In terms of in labor force | age 16-19, the demographic groups most similar to Salvadorans are Hispanic or Latino (34.5%, a difference of 0.010%), Egyptian (34.5%, a difference of 0.040%), Burmese (34.5%, a difference of 0.050%), Immigrants (34.6%, a difference of 0.12%), and Immigrants from Egypt (34.6%, a difference of 0.14%).
| Demographics | Rating | Rank | In Labor Force | Age 16-19 |
| Bahamians | 1.4 /100 | #254 | Tragic 34.6% |
| Peruvians | 1.4 /100 | #255 | Tragic 34.6% |
| Immigrants | South Central Asia | 1.3 /100 | #256 | Tragic 34.6% |
| Immigrants | Egypt | 1.2 /100 | #257 | Tragic 34.6% |
| Thais | 1.2 /100 | #258 | Tragic 34.6% |
| Immigrants | Immigrants | 1.2 /100 | #259 | Tragic 34.6% |
| Egyptians | 1.2 /100 | #260 | Tragic 34.5% |
| Salvadorans | 1.1 /100 | #261 | Tragic 34.5% |
| Hispanics or Latinos | 1.1 /100 | #262 | Tragic 34.5% |
| Burmese | 1.1 /100 | #263 | Tragic 34.5% |
| Immigrants | Uruguay | 0.9 /100 | #264 | Tragic 34.4% |
| Immigrants | El Salvador | 0.7 /100 | #265 | Tragic 34.3% |
| Immigrants | Malaysia | 0.7 /100 | #266 | Tragic 34.3% |
| Immigrants | Peru | 0.5 /100 | #267 | Tragic 34.2% |
| Immigrants | Asia | 0.5 /100 | #268 | Tragic 34.1% |
Demographics Similar to Puget Sound Salish by In Labor Force | Age 16-19
In terms of in labor force | age 16-19, the demographic groups most similar to Puget Sound Salish are Alaska Native (39.1%, a difference of 0.010%), Immigrants from Germany (39.1%, a difference of 0.070%), Immigrants from Burma/Myanmar (39.0%, a difference of 0.090%), Samoan (39.1%, a difference of 0.16%), and Creek (39.1%, a difference of 0.17%).
| Demographics | Rating | Rank | In Labor Force | Age 16-19 |
| Shoshone | 99.7 /100 | #81 | Exceptional 39.3% |
| Basques | 99.7 /100 | #82 | Exceptional 39.3% |
| Spanish | 99.7 /100 | #83 | Exceptional 39.3% |
| Immigrants | Uganda | 99.7 /100 | #84 | Exceptional 39.2% |
| Creek | 99.6 /100 | #85 | Exceptional 39.1% |
| Samoans | 99.6 /100 | #86 | Exceptional 39.1% |
| Immigrants | Germany | 99.6 /100 | #87 | Exceptional 39.1% |
| Puget Sound Salish | 99.6 /100 | #88 | Exceptional 39.1% |
| Alaska Natives | 99.6 /100 | #89 | Exceptional 39.1% |
| Immigrants | Burma/Myanmar | 99.5 /100 | #90 | Exceptional 39.0% |
| Spanish Americans | 99.5 /100 | #91 | Exceptional 39.0% |
| Osage | 99.4 /100 | #92 | Exceptional 39.0% |
| Blackfeet | 99.4 /100 | #93 | Exceptional 38.9% |
| Immigrants | Canada | 99.4 /100 | #94 | Exceptional 38.9% |
| Immigrants | North America | 99.4 /100 | #95 | Exceptional 38.9% |