Indian (Asian) vs Aleut In Labor Force | Age 16-19
COMPARE
Indian (Asian)
Aleut
In Labor Force | Age 16-19
In Labor Force | Age 16-19 Comparison
Indians (Asian)
Aleuts
31.9%
IN LABOR FORCE | AGE 16-19
0.0/ 100
METRIC RATING
311th/ 347
METRIC RANK
40.4%
IN LABOR FORCE | AGE 16-19
100.0/ 100
METRIC RATING
58th/ 347
METRIC RANK
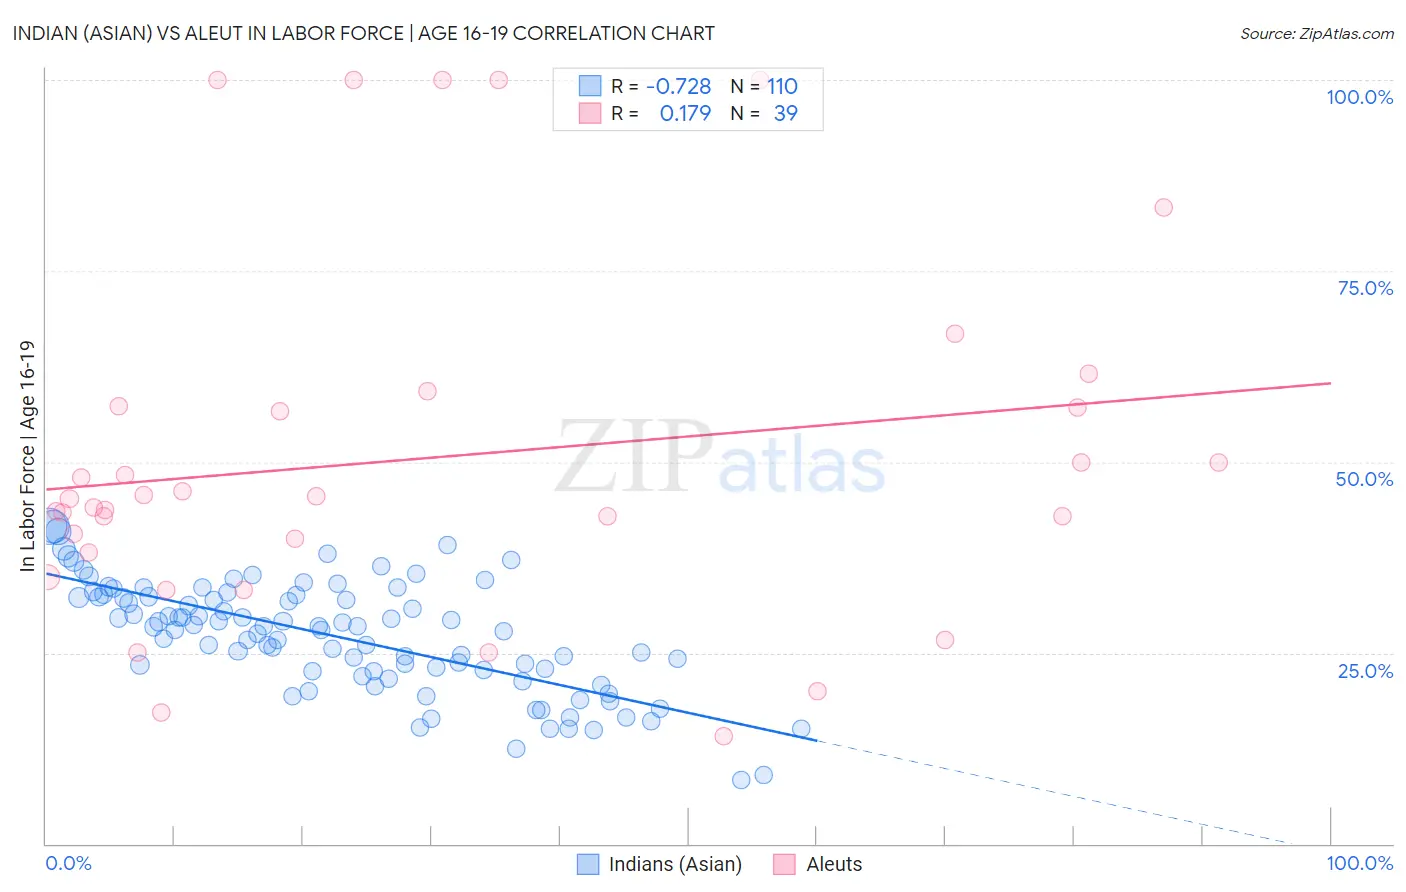
Indian (Asian) vs Aleut In Labor Force | Age 16-19 Correlation Chart
The statistical analysis conducted on geographies consisting of 494,104,019 people shows a strong negative correlation between the proportion of Indians (Asian) and labor force participation rate among population between the ages 16 and 19 in the United States with a correlation coefficient (R) of -0.728 and weighted average of 31.9%. Similarly, the statistical analysis conducted on geographies consisting of 61,744,567 people shows a poor positive correlation between the proportion of Aleuts and labor force participation rate among population between the ages 16 and 19 in the United States with a correlation coefficient (R) of 0.179 and weighted average of 40.4%, a difference of 26.9%.
In Labor Force | Age 16-19 Correlation Summary
| Measurement | Indian (Asian) | Aleut |
| Minimum | 8.3% | 14.1% |
| Maximum | 41.5% | 100.0% |
| Range | 33.2% | 85.9% |
| Mean | 27.1% | 50.6% |
| Median | 28.4% | 45.1% |
| Interquartile 25% (IQ1) | 22.7% | 38.2% |
| Interquartile 75% (IQ3) | 32.3% | 57.3% |
| Interquartile Range (IQR) | 9.7% | 19.1% |
| Standard Deviation (Sample) | 7.2% | 23.4% |
| Standard Deviation (Population) | 7.2% | 23.1% |
Similar Demographics by In Labor Force | Age 16-19
Demographics Similar to Indians (Asian) by In Labor Force | Age 16-19
In terms of in labor force | age 16-19, the demographic groups most similar to Indians (Asian) are Immigrants from Belize (31.8%, a difference of 0.14%), Hopi (31.8%, a difference of 0.15%), Cuban (31.8%, a difference of 0.31%), Immigrants from Iran (32.0%, a difference of 0.37%), and Immigrants from West Indies (31.7%, a difference of 0.49%).
| Demographics | Rating | Rank | In Labor Force | Age 16-19 |
| Israelis | 0.0 /100 | #304 | Tragic 32.4% |
| Nicaraguans | 0.0 /100 | #305 | Tragic 32.4% |
| Spanish American Indians | 0.0 /100 | #306 | Tragic 32.4% |
| Immigrants | Jamaica | 0.0 /100 | #307 | Tragic 32.2% |
| Navajo | 0.0 /100 | #308 | Tragic 32.1% |
| Immigrants | Eastern Asia | 0.0 /100 | #309 | Tragic 32.0% |
| Immigrants | Iran | 0.0 /100 | #310 | Tragic 32.0% |
| Indians (Asian) | 0.0 /100 | #311 | Tragic 31.9% |
| Immigrants | Belize | 0.0 /100 | #312 | Tragic 31.8% |
| Hopi | 0.0 /100 | #313 | Tragic 31.8% |
| Cubans | 0.0 /100 | #314 | Tragic 31.8% |
| Immigrants | West Indies | 0.0 /100 | #315 | Tragic 31.7% |
| Filipinos | 0.0 /100 | #316 | Tragic 31.7% |
| Immigrants | Nicaragua | 0.0 /100 | #317 | Tragic 31.6% |
| Immigrants | Yemen | 0.0 /100 | #318 | Tragic 31.5% |
Demographics Similar to Aleuts by In Labor Force | Age 16-19
In terms of in labor force | age 16-19, the demographic groups most similar to Aleuts are Lithuanian (40.4%, a difference of 0.010%), Fijian (40.4%, a difference of 0.040%), British (40.5%, a difference of 0.13%), Slavic (40.4%, a difference of 0.13%), and Tlingit-Haida (40.5%, a difference of 0.16%).
| Demographics | Rating | Rank | In Labor Force | Age 16-19 |
| Immigrants | Zaire | 100.0 /100 | #51 | Exceptional 40.7% |
| Immigrants | Laos | 100.0 /100 | #52 | Exceptional 40.6% |
| Immigrants | Kenya | 100.0 /100 | #53 | Exceptional 40.5% |
| Tlingit-Haida | 100.0 /100 | #54 | Exceptional 40.5% |
| British | 100.0 /100 | #55 | Exceptional 40.5% |
| Fijians | 100.0 /100 | #56 | Exceptional 40.4% |
| Lithuanians | 100.0 /100 | #57 | Exceptional 40.4% |
| Aleuts | 100.0 /100 | #58 | Exceptional 40.4% |
| Slavs | 100.0 /100 | #59 | Exceptional 40.4% |
| Immigrants | Eastern Africa | 100.0 /100 | #60 | Exceptional 40.4% |
| Americans | 100.0 /100 | #61 | Exceptional 40.3% |
| Cherokee | 100.0 /100 | #62 | Exceptional 40.2% |
| Northern Europeans | 100.0 /100 | #63 | Exceptional 40.2% |
| Immigrants | Micronesia | 100.0 /100 | #64 | Exceptional 40.2% |
| Kenyans | 100.0 /100 | #65 | Exceptional 40.1% |