Immigrants from Saudi Arabia vs Puget Sound Salish In Labor Force | Age 16-19
COMPARE
Immigrants from Saudi Arabia
Puget Sound Salish
In Labor Force | Age 16-19
In Labor Force | Age 16-19 Comparison
Immigrants from Saudi Arabia
Puget Sound Salish
37.0%
IN LABOR FORCE | AGE 16-19
73.9/ 100
METRIC RATING
160th/ 347
METRIC RANK
39.1%
IN LABOR FORCE | AGE 16-19
99.6/ 100
METRIC RATING
88th/ 347
METRIC RANK
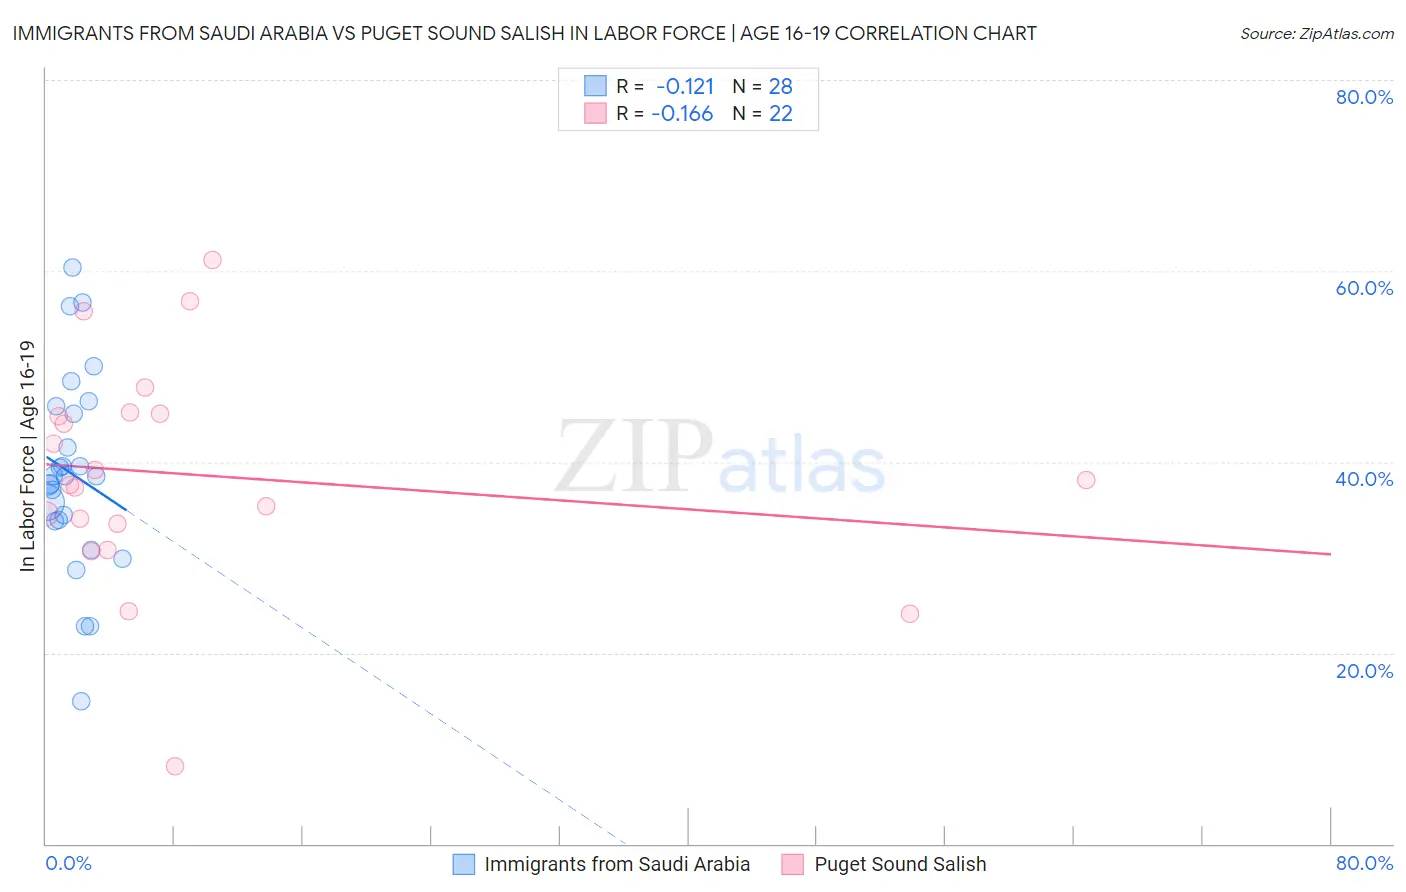
Immigrants from Saudi Arabia vs Puget Sound Salish In Labor Force | Age 16-19 Correlation Chart
The statistical analysis conducted on geographies consisting of 164,246,290 people shows a poor negative correlation between the proportion of Immigrants from Saudi Arabia and labor force participation rate among population between the ages 16 and 19 in the United States with a correlation coefficient (R) of -0.121 and weighted average of 37.0%. Similarly, the statistical analysis conducted on geographies consisting of 46,131,142 people shows a poor negative correlation between the proportion of Puget Sound Salish and labor force participation rate among population between the ages 16 and 19 in the United States with a correlation coefficient (R) of -0.166 and weighted average of 39.1%, a difference of 5.5%.
In Labor Force | Age 16-19 Correlation Summary
| Measurement | Immigrants from Saudi Arabia | Puget Sound Salish |
| Minimum | 14.9% | 8.1% |
| Maximum | 60.4% | 61.2% |
| Range | 45.5% | 53.1% |
| Mean | 38.7% | 38.6% |
| Median | 38.5% | 37.8% |
| Interquartile 25% (IQ1) | 33.9% | 33.5% |
| Interquartile 75% (IQ3) | 45.4% | 45.0% |
| Interquartile Range (IQR) | 11.6% | 11.5% |
| Standard Deviation (Sample) | 10.3% | 11.8% |
| Standard Deviation (Population) | 10.1% | 11.5% |
Similar Demographics by In Labor Force | Age 16-19
Demographics Similar to Immigrants from Saudi Arabia by In Labor Force | Age 16-19
In terms of in labor force | age 16-19, the demographic groups most similar to Immigrants from Saudi Arabia are Yaqui (37.1%, a difference of 0.030%), Ute (37.1%, a difference of 0.12%), Cambodian (37.0%, a difference of 0.15%), Immigrants from Brazil (37.1%, a difference of 0.17%), and Immigrants from Jordan (36.9%, a difference of 0.27%).
| Demographics | Rating | Rank | In Labor Force | Age 16-19 |
| Arapaho | 81.8 /100 | #153 | Excellent 37.3% |
| Immigrants | Bulgaria | 81.6 /100 | #154 | Excellent 37.3% |
| Immigrants | Lithuania | 80.7 /100 | #155 | Excellent 37.2% |
| Kiowa | 80.4 /100 | #156 | Excellent 37.2% |
| Immigrants | Brazil | 76.5 /100 | #157 | Good 37.1% |
| Ute | 75.7 /100 | #158 | Good 37.1% |
| Yaqui | 74.4 /100 | #159 | Good 37.1% |
| Immigrants | Saudi Arabia | 73.9 /100 | #160 | Good 37.0% |
| Cambodians | 71.5 /100 | #161 | Good 37.0% |
| Immigrants | Jordan | 69.5 /100 | #162 | Good 36.9% |
| Bermudans | 69.3 /100 | #163 | Good 36.9% |
| Immigrants | Kuwait | 68.9 /100 | #164 | Good 36.9% |
| Yakama | 66.9 /100 | #165 | Good 36.9% |
| Immigrants | Western Africa | 66.7 /100 | #166 | Good 36.9% |
| Arabs | 63.6 /100 | #167 | Good 36.8% |
Demographics Similar to Puget Sound Salish by In Labor Force | Age 16-19
In terms of in labor force | age 16-19, the demographic groups most similar to Puget Sound Salish are Alaska Native (39.1%, a difference of 0.010%), Immigrants from Germany (39.1%, a difference of 0.070%), Immigrants from Burma/Myanmar (39.0%, a difference of 0.090%), Samoan (39.1%, a difference of 0.16%), and Creek (39.1%, a difference of 0.17%).
| Demographics | Rating | Rank | In Labor Force | Age 16-19 |
| Shoshone | 99.7 /100 | #81 | Exceptional 39.3% |
| Basques | 99.7 /100 | #82 | Exceptional 39.3% |
| Spanish | 99.7 /100 | #83 | Exceptional 39.3% |
| Immigrants | Uganda | 99.7 /100 | #84 | Exceptional 39.2% |
| Creek | 99.6 /100 | #85 | Exceptional 39.1% |
| Samoans | 99.6 /100 | #86 | Exceptional 39.1% |
| Immigrants | Germany | 99.6 /100 | #87 | Exceptional 39.1% |
| Puget Sound Salish | 99.6 /100 | #88 | Exceptional 39.1% |
| Alaska Natives | 99.6 /100 | #89 | Exceptional 39.1% |
| Immigrants | Burma/Myanmar | 99.5 /100 | #90 | Exceptional 39.0% |
| Spanish Americans | 99.5 /100 | #91 | Exceptional 39.0% |
| Osage | 99.4 /100 | #92 | Exceptional 39.0% |
| Blackfeet | 99.4 /100 | #93 | Exceptional 38.9% |
| Immigrants | Canada | 99.4 /100 | #94 | Exceptional 38.9% |
| Immigrants | North America | 99.4 /100 | #95 | Exceptional 38.9% |