Potawatomi vs Puget Sound Salish In Labor Force | Age 16-19
COMPARE
Potawatomi
Puget Sound Salish
In Labor Force | Age 16-19
In Labor Force | Age 16-19 Comparison
Potawatomi
Puget Sound Salish
40.0%
IN LABOR FORCE | AGE 16-19
99.9/ 100
METRIC RATING
69th/ 347
METRIC RANK
39.1%
IN LABOR FORCE | AGE 16-19
99.6/ 100
METRIC RATING
88th/ 347
METRIC RANK
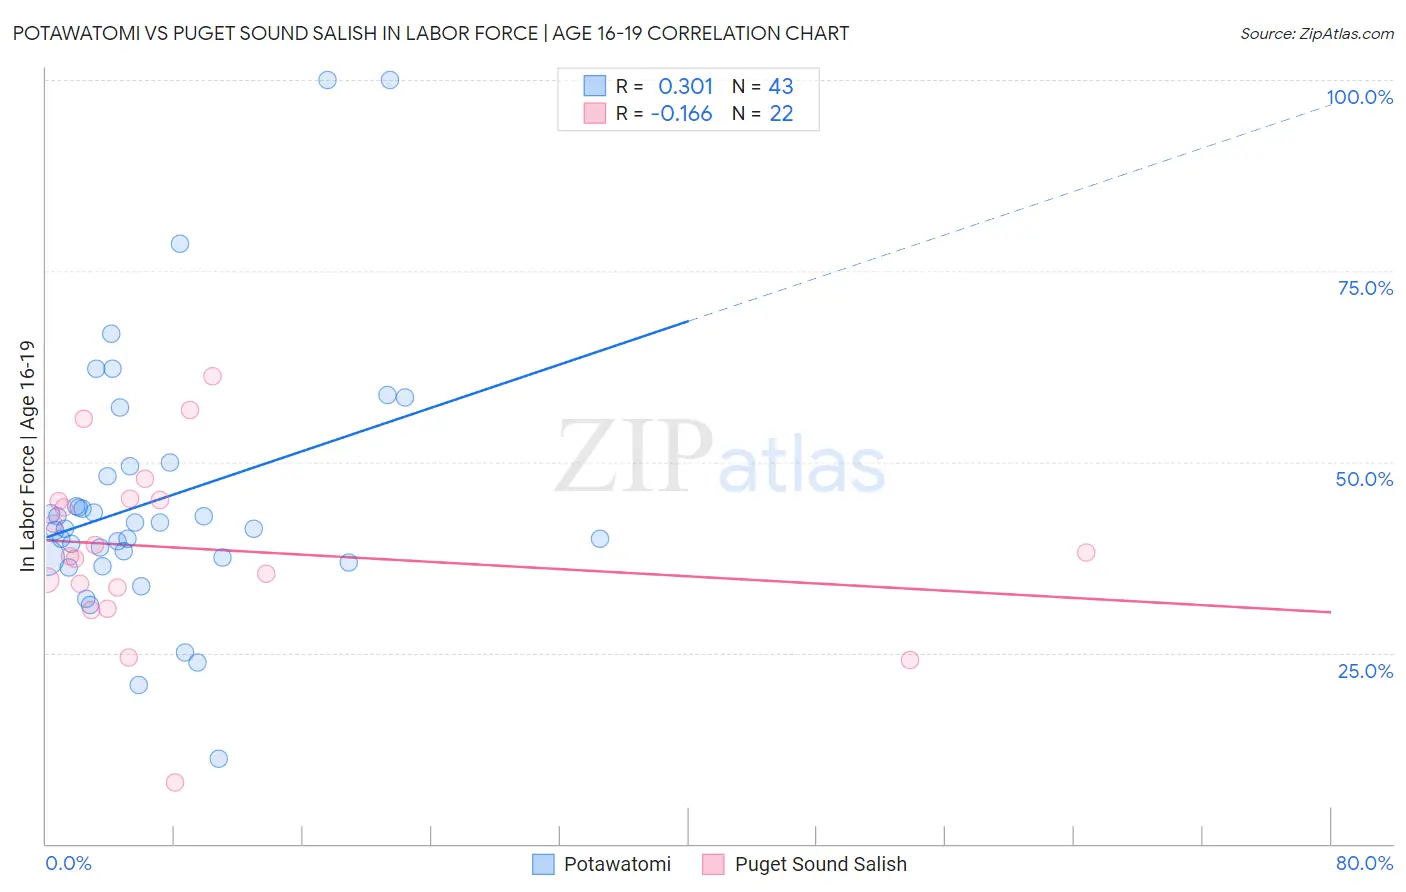
Potawatomi vs Puget Sound Salish In Labor Force | Age 16-19 Correlation Chart
The statistical analysis conducted on geographies consisting of 117,698,068 people shows a mild positive correlation between the proportion of Potawatomi and labor force participation rate among population between the ages 16 and 19 in the United States with a correlation coefficient (R) of 0.301 and weighted average of 40.0%. Similarly, the statistical analysis conducted on geographies consisting of 46,131,142 people shows a poor negative correlation between the proportion of Puget Sound Salish and labor force participation rate among population between the ages 16 and 19 in the United States with a correlation coefficient (R) of -0.166 and weighted average of 39.1%, a difference of 2.5%.
In Labor Force | Age 16-19 Correlation Summary
| Measurement | Potawatomi | Puget Sound Salish |
| Minimum | 11.1% | 8.1% |
| Maximum | 100.0% | 61.2% |
| Range | 88.9% | 53.1% |
| Mean | 45.1% | 38.6% |
| Median | 41.3% | 37.8% |
| Interquartile 25% (IQ1) | 37.4% | 33.5% |
| Interquartile 75% (IQ3) | 49.5% | 45.0% |
| Interquartile Range (IQR) | 12.1% | 11.5% |
| Standard Deviation (Sample) | 17.3% | 11.8% |
| Standard Deviation (Population) | 17.1% | 11.5% |
Demographics Similar to Potawatomi and Puget Sound Salish by In Labor Force | Age 16-19
In terms of in labor force | age 16-19, the demographic groups most similar to Potawatomi are Portuguese (40.0%, a difference of 0.050%), Italian (40.1%, a difference of 0.070%), Serbian (39.9%, a difference of 0.22%), Iroquois (39.9%, a difference of 0.22%), and Immigrants from Middle Africa (39.9%, a difference of 0.26%). Similarly, the demographic groups most similar to Puget Sound Salish are Immigrants from Germany (39.1%, a difference of 0.070%), Samoan (39.1%, a difference of 0.16%), Creek (39.1%, a difference of 0.17%), Immigrants from Uganda (39.2%, a difference of 0.33%), and Spanish (39.3%, a difference of 0.45%).
| Demographics | Rating | Rank | In Labor Force | Age 16-19 |
| Italians | 99.9 /100 | #68 | Exceptional 40.1% |
| Potawatomi | 99.9 /100 | #69 | Exceptional 40.0% |
| Portuguese | 99.9 /100 | #70 | Exceptional 40.0% |
| Serbians | 99.9 /100 | #71 | Exceptional 39.9% |
| Iroquois | 99.9 /100 | #72 | Exceptional 39.9% |
| Immigrants | Middle Africa | 99.9 /100 | #73 | Exceptional 39.9% |
| Hungarians | 99.9 /100 | #74 | Exceptional 39.8% |
| French American Indians | 99.9 /100 | #75 | Exceptional 39.8% |
| Malaysians | 99.9 /100 | #76 | Exceptional 39.7% |
| Immigrants | Portugal | 99.9 /100 | #77 | Exceptional 39.7% |
| Austrians | 99.8 /100 | #78 | Exceptional 39.5% |
| Marshallese | 99.8 /100 | #79 | Exceptional 39.5% |
| Immigrants | Iraq | 99.8 /100 | #80 | Exceptional 39.4% |
| Shoshone | 99.7 /100 | #81 | Exceptional 39.3% |
| Basques | 99.7 /100 | #82 | Exceptional 39.3% |
| Spanish | 99.7 /100 | #83 | Exceptional 39.3% |
| Immigrants | Uganda | 99.7 /100 | #84 | Exceptional 39.2% |
| Creek | 99.6 /100 | #85 | Exceptional 39.1% |
| Samoans | 99.6 /100 | #86 | Exceptional 39.1% |
| Immigrants | Germany | 99.6 /100 | #87 | Exceptional 39.1% |
| Puget Sound Salish | 99.6 /100 | #88 | Exceptional 39.1% |