Indian (Asian) vs Cypriot In Labor Force | Age 16-19
COMPARE
Indian (Asian)
Cypriot
In Labor Force | Age 16-19
In Labor Force | Age 16-19 Comparison
Indians (Asian)
Cypriots
31.9%
IN LABOR FORCE | AGE 16-19
0.0/ 100
METRIC RATING
311th/ 347
METRIC RANK
33.8%
IN LABOR FORCE | AGE 16-19
0.3/ 100
METRIC RATING
281st/ 347
METRIC RANK
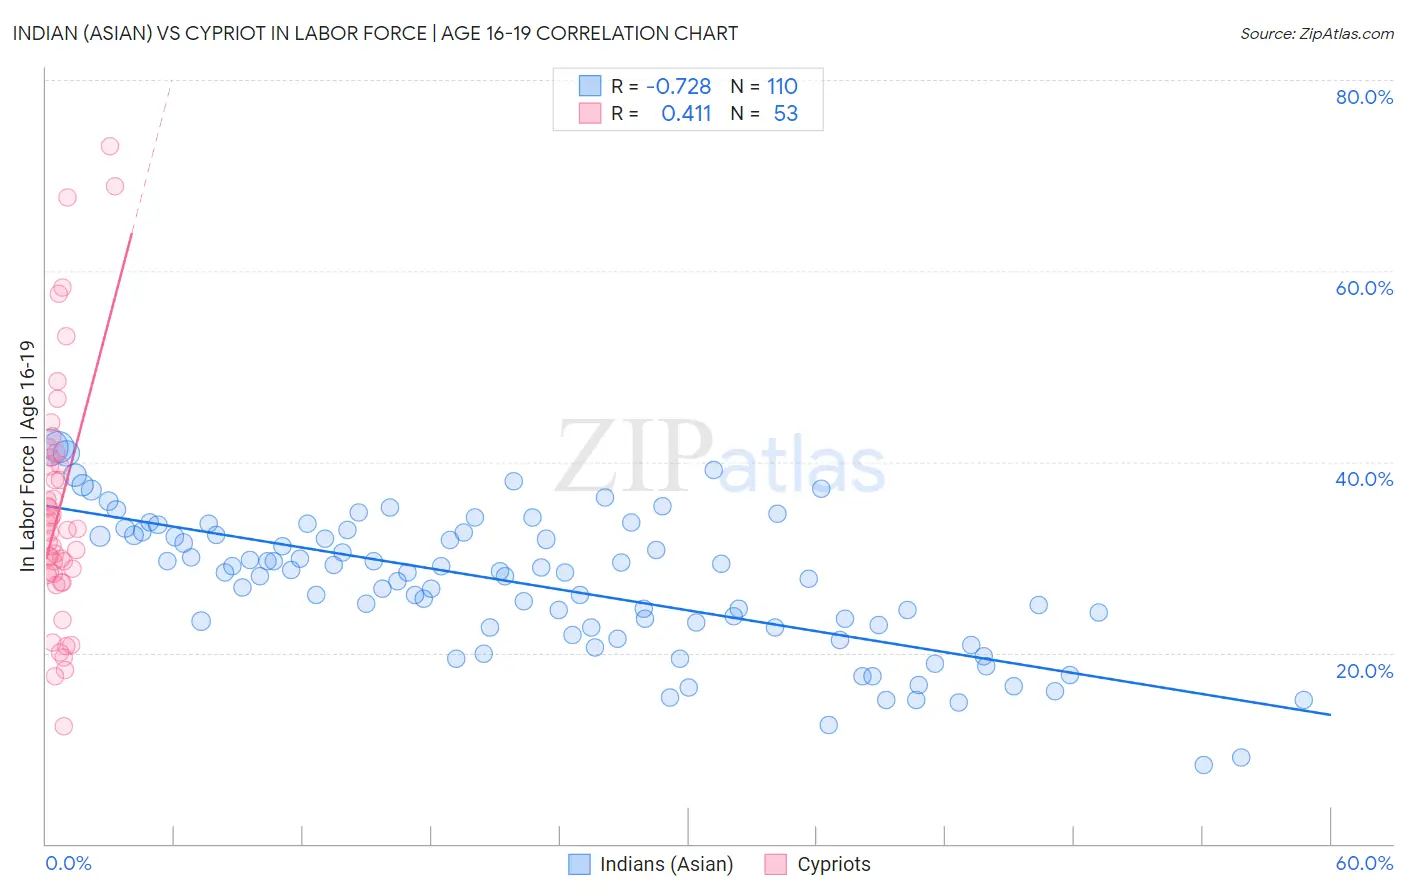
Indian (Asian) vs Cypriot In Labor Force | Age 16-19 Correlation Chart
The statistical analysis conducted on geographies consisting of 494,104,019 people shows a strong negative correlation between the proportion of Indians (Asian) and labor force participation rate among population between the ages 16 and 19 in the United States with a correlation coefficient (R) of -0.728 and weighted average of 31.9%. Similarly, the statistical analysis conducted on geographies consisting of 61,837,622 people shows a moderate positive correlation between the proportion of Cypriots and labor force participation rate among population between the ages 16 and 19 in the United States with a correlation coefficient (R) of 0.411 and weighted average of 33.8%, a difference of 6.1%.
In Labor Force | Age 16-19 Correlation Summary
| Measurement | Indian (Asian) | Cypriot |
| Minimum | 8.3% | 12.3% |
| Maximum | 41.5% | 73.0% |
| Range | 33.2% | 60.7% |
| Mean | 27.1% | 35.1% |
| Median | 28.4% | 32.9% |
| Interquartile 25% (IQ1) | 22.7% | 28.2% |
| Interquartile 75% (IQ3) | 32.3% | 40.1% |
| Interquartile Range (IQR) | 9.7% | 11.9% |
| Standard Deviation (Sample) | 7.2% | 12.8% |
| Standard Deviation (Population) | 7.2% | 12.7% |
Similar Demographics by In Labor Force | Age 16-19
Demographics Similar to Indians (Asian) by In Labor Force | Age 16-19
In terms of in labor force | age 16-19, the demographic groups most similar to Indians (Asian) are Immigrants from Belize (31.8%, a difference of 0.14%), Hopi (31.8%, a difference of 0.15%), Cuban (31.8%, a difference of 0.31%), Immigrants from Iran (32.0%, a difference of 0.37%), and Immigrants from West Indies (31.7%, a difference of 0.49%).
| Demographics | Rating | Rank | In Labor Force | Age 16-19 |
| Israelis | 0.0 /100 | #304 | Tragic 32.4% |
| Nicaraguans | 0.0 /100 | #305 | Tragic 32.4% |
| Spanish American Indians | 0.0 /100 | #306 | Tragic 32.4% |
| Immigrants | Jamaica | 0.0 /100 | #307 | Tragic 32.2% |
| Navajo | 0.0 /100 | #308 | Tragic 32.1% |
| Immigrants | Eastern Asia | 0.0 /100 | #309 | Tragic 32.0% |
| Immigrants | Iran | 0.0 /100 | #310 | Tragic 32.0% |
| Indians (Asian) | 0.0 /100 | #311 | Tragic 31.9% |
| Immigrants | Belize | 0.0 /100 | #312 | Tragic 31.8% |
| Hopi | 0.0 /100 | #313 | Tragic 31.8% |
| Cubans | 0.0 /100 | #314 | Tragic 31.8% |
| Immigrants | West Indies | 0.0 /100 | #315 | Tragic 31.7% |
| Filipinos | 0.0 /100 | #316 | Tragic 31.7% |
| Immigrants | Nicaragua | 0.0 /100 | #317 | Tragic 31.6% |
| Immigrants | Yemen | 0.0 /100 | #318 | Tragic 31.5% |
Demographics Similar to Cypriots by In Labor Force | Age 16-19
In terms of in labor force | age 16-19, the demographic groups most similar to Cypriots are Paraguayan (33.8%, a difference of 0.010%), Taiwanese (33.8%, a difference of 0.010%), Immigrants from Korea (33.8%, a difference of 0.010%), Colombian (33.8%, a difference of 0.020%), and Menominee (33.9%, a difference of 0.10%).
| Demographics | Rating | Rank | In Labor Force | Age 16-19 |
| Venezuelans | 0.3 /100 | #274 | Tragic 34.0% |
| Immigrants | Fiji | 0.3 /100 | #275 | Tragic 33.9% |
| Immigrants | Latin America | 0.3 /100 | #276 | Tragic 33.9% |
| Menominee | 0.3 /100 | #277 | Tragic 33.9% |
| Colombians | 0.3 /100 | #278 | Tragic 33.8% |
| Paraguayans | 0.3 /100 | #279 | Tragic 33.8% |
| Taiwanese | 0.3 /100 | #280 | Tragic 33.8% |
| Cypriots | 0.3 /100 | #281 | Tragic 33.8% |
| Immigrants | Korea | 0.3 /100 | #282 | Tragic 33.8% |
| Immigrants | Venezuela | 0.2 /100 | #283 | Tragic 33.7% |
| Immigrants | Spain | 0.2 /100 | #284 | Tragic 33.7% |
| U.S. Virgin Islanders | 0.2 /100 | #285 | Tragic 33.6% |
| South Americans | 0.2 /100 | #286 | Tragic 33.6% |
| Nepalese | 0.1 /100 | #287 | Tragic 33.5% |
| Immigrants | Indonesia | 0.1 /100 | #288 | Tragic 33.5% |