Indian (Asian) vs Puget Sound Salish Professional Degree
COMPARE
Indian (Asian)
Puget Sound Salish
Professional Degree
Professional Degree Comparison
Indians (Asian)
Puget Sound Salish
6.5%
PROFESSIONAL DEGREE
100.0/ 100
METRIC RATING
19th/ 347
METRIC RANK
3.1%
PROFESSIONAL DEGREE
0.0/ 100
METRIC RATING
333rd/ 347
METRIC RANK
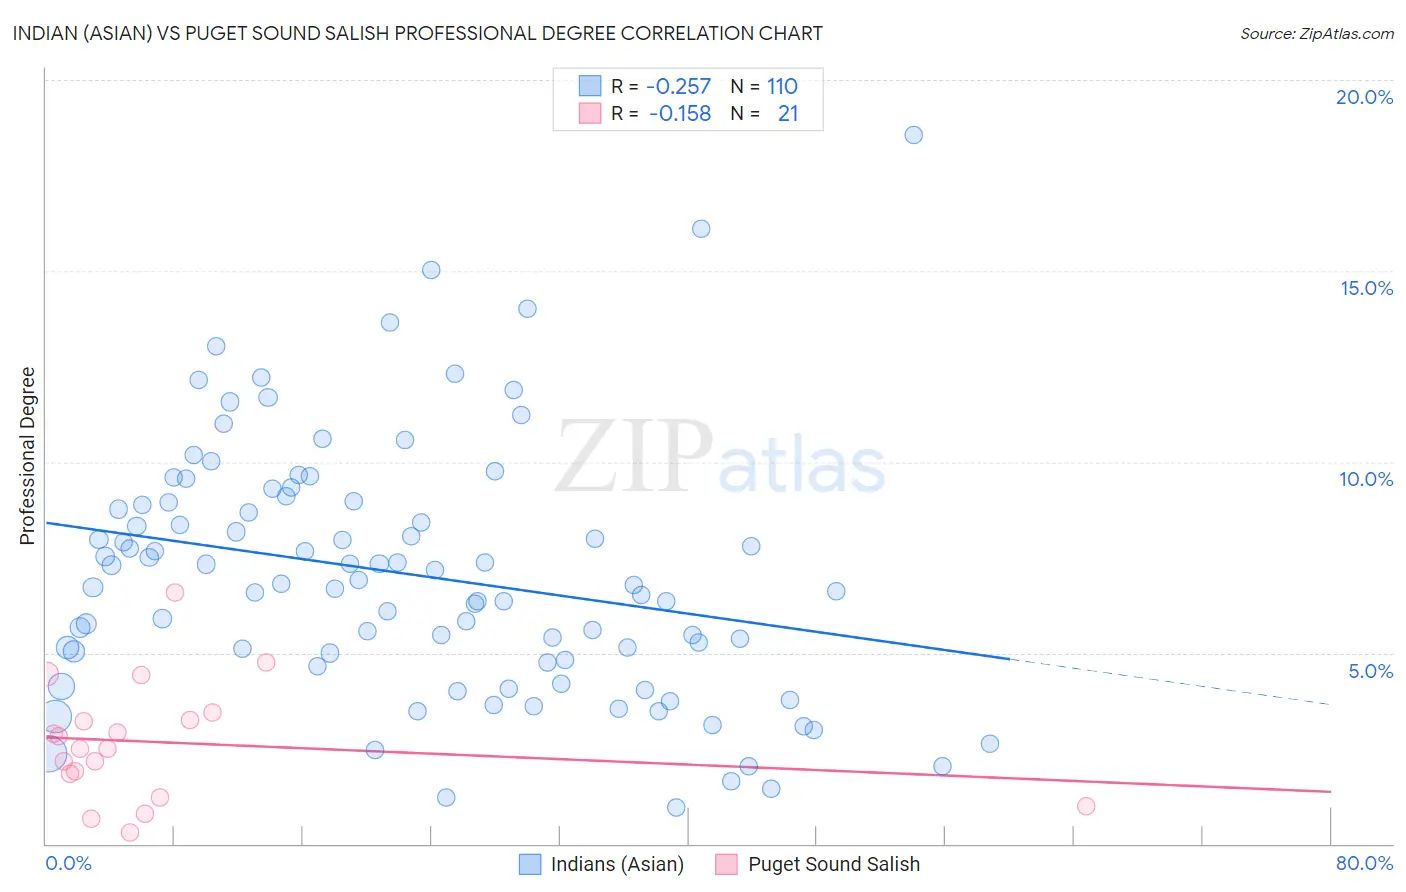
Indian (Asian) vs Puget Sound Salish Professional Degree Correlation Chart
The statistical analysis conducted on geographies consisting of 493,505,427 people shows a weak negative correlation between the proportion of Indians (Asian) and percentage of population with at least professional degree education in the United States with a correlation coefficient (R) of -0.257 and weighted average of 6.5%. Similarly, the statistical analysis conducted on geographies consisting of 46,093,850 people shows a poor negative correlation between the proportion of Puget Sound Salish and percentage of population with at least professional degree education in the United States with a correlation coefficient (R) of -0.158 and weighted average of 3.1%, a difference of 111.8%.
Professional Degree Correlation Summary
| Measurement | Indian (Asian) | Puget Sound Salish |
| Minimum | 0.96% | 0.31% |
| Maximum | 18.6% | 6.6% |
| Range | 17.6% | 6.3% |
| Mean | 7.1% | 2.7% |
| Median | 6.8% | 2.5% |
| Interquartile 25% (IQ1) | 4.8% | 1.5% |
| Interquartile 75% (IQ3) | 8.9% | 3.3% |
| Interquartile Range (IQR) | 4.1% | 1.8% |
| Standard Deviation (Sample) | 3.3% | 1.5% |
| Standard Deviation (Population) | 3.3% | 1.5% |
Similar Demographics by Professional Degree
Demographics Similar to Indians (Asian) by Professional Degree
In terms of professional degree, the demographic groups most similar to Indians (Asian) are Soviet Union (6.6%, a difference of 0.66%), Immigrants from Eastern Asia (6.6%, a difference of 0.68%), Immigrants from Denmark (6.4%, a difference of 1.5%), Immigrants from Hong Kong (6.4%, a difference of 1.8%), and Immigrants from Japan (6.4%, a difference of 2.5%).
| Demographics | Rating | Rank | Professional Degree |
| Israelis | 100.0 /100 | #12 | Exceptional 6.9% |
| Immigrants | Australia | 100.0 /100 | #13 | Exceptional 6.9% |
| Immigrants | France | 100.0 /100 | #14 | Exceptional 6.8% |
| Immigrants | China | 100.0 /100 | #15 | Exceptional 6.7% |
| Immigrants | Sweden | 100.0 /100 | #16 | Exceptional 6.7% |
| Immigrants | Eastern Asia | 100.0 /100 | #17 | Exceptional 6.6% |
| Soviet Union | 100.0 /100 | #18 | Exceptional 6.6% |
| Indians (Asian) | 100.0 /100 | #19 | Exceptional 6.5% |
| Immigrants | Denmark | 100.0 /100 | #20 | Exceptional 6.4% |
| Immigrants | Hong Kong | 100.0 /100 | #21 | Exceptional 6.4% |
| Immigrants | Japan | 100.0 /100 | #22 | Exceptional 6.4% |
| Russians | 100.0 /100 | #23 | Exceptional 6.3% |
| Immigrants | Spain | 100.0 /100 | #24 | Exceptional 6.3% |
| Immigrants | Ireland | 100.0 /100 | #25 | Exceptional 6.3% |
| Latvians | 100.0 /100 | #26 | Exceptional 6.2% |
Demographics Similar to Puget Sound Salish by Professional Degree
In terms of professional degree, the demographic groups most similar to Puget Sound Salish are Yakama (3.1%, a difference of 0.030%), Kiowa (3.1%, a difference of 0.14%), Immigrants from Cabo Verde (3.1%, a difference of 0.26%), Bangladeshi (3.1%, a difference of 0.34%), and Creek (3.1%, a difference of 0.55%).
| Demographics | Rating | Rank | Professional Degree |
| Menominee | 0.0 /100 | #326 | Tragic 3.1% |
| Dutch West Indians | 0.0 /100 | #327 | Tragic 3.1% |
| Creek | 0.0 /100 | #328 | Tragic 3.1% |
| Bangladeshis | 0.0 /100 | #329 | Tragic 3.1% |
| Immigrants | Cabo Verde | 0.0 /100 | #330 | Tragic 3.1% |
| Kiowa | 0.0 /100 | #331 | Tragic 3.1% |
| Yakama | 0.0 /100 | #332 | Tragic 3.1% |
| Puget Sound Salish | 0.0 /100 | #333 | Tragic 3.1% |
| Pennsylvania Germans | 0.0 /100 | #334 | Tragic 3.0% |
| Natives/Alaskans | 0.0 /100 | #335 | Tragic 3.0% |
| Fijians | 0.0 /100 | #336 | Tragic 2.9% |
| Arapaho | 0.0 /100 | #337 | Tragic 2.9% |
| Navajo | 0.0 /100 | #338 | Tragic 2.9% |
| Immigrants | Central America | 0.0 /100 | #339 | Tragic 2.9% |
| Yup'ik | 0.0 /100 | #340 | Tragic 2.9% |