Indian (Asian) vs Puget Sound Salish Householder Income Under 25 years

COMPARE

Indian (Asian)
Race
Ancestry
AfghanAfricanAlaska NativeAlaskan AthabascanAlbanianAleutAlsatianAmericanApacheArabArapahoArgentineanArmenianAssyrian/Chaldean/SyriacAustralianAustrianBahamianBangladeshiBarbadianBasqueBelgianBelizeanBermudanBhutaneseBlackfeetBolivianBrazilianBritishBritish West IndianBulgarianBurmeseCajunCambodianCanadianCape VerdeanCarpatho RusynCelticCentral AmericanCentral American IndianCherokeeCheyenneChickasawChileanChineseChippewaChoctawColombianColvilleComancheCosta RicanCreeCreekCroatianCrowCubanCypriotCzechCzechoslovakianDanishDelawareDominicanDutchDutch West IndianEastern EuropeanEcuadorianEgyptianEnglishEstonianEthiopianEuropeanFijianFilipinoFinnishFrenchFrench American IndianFrench CanadianGermanGerman RussianGhanaianGreekGuamanian/ChamorroGuatemalanGuyaneseHaitianHmongHonduranHopiHoumaHungarianIcelanderIndian (Asian)IndonesianInupiatIranianIraqiIrishIroquoisIsraeliItalianJamaicanJapaneseJordanianKenyanKiowaKoreanLaotianLatvianLebaneseLiberianLithuanianLumbeeLuxembourgerMacedonianMalaysianMalteseMarshalleseMenomineeMexicanMexican American IndianMongolianMoroccanNative HawaiianNavajoNepaleseNew ZealanderNicaraguanNigerianNorthern EuropeanNorwegianOkinawanOsageOttawaPaiutePakistaniPalestinianPanamanianParaguayanPennsylvania GermanPeruvianPimaPolishPortuguesePotawatomiPuebloPuerto RicanRomanianRussianSalvadoranSamoanScandinavianScotch-IrishScottishSeminoleSenegaleseSerbianShoshoneSierra LeoneanSiouxSlavicSlovakSloveneSomaliSouth AfricanSouth AmericanSouth American IndianSoviet UnionSpaniardSpanishSpanish AmericanSpanish American IndianSri LankanSubsaharan AfricanSudaneseSwedishSwissSyrianTaiwaneseThaiTlingit-HaidaTohono O'OdhamTonganTrinidadian and TobagonianTsimshianTurkishU.S. Virgin IslanderUgandanUkrainianUruguayanUteVenezuelanVietnameseWelshWest IndianYakamaYaquiYugoslavianYumanYup'ikZimbabwean
Immigration
NonimmigrantsImmigrantsAfghanistanAfricaAlbaniaArgentinaArmeniaAsiaAustraliaAustriaBahamasBangladeshBarbadosBelarusBelgiumBelizeBoliviaBosnia and HerzegovinaBrazilBulgariaBurma/MyanmarCabo VerdeCambodiaCameroonCanadaCaribbeanCentral AmericaChileChinaColombiaCongoCosta RicaCroatiaCubaCzechoslovakiaDenmarkDominicaDominican RepublicEastern AfricaEastern AsiaEastern EuropeEcuadorEgyptEl SalvadorEnglandEritreaEthiopiaEuropeFijiFranceGermanyGhanaGreeceGrenadaGuatemalaGuyanaHaitiHondurasHong KongHungaryIndiaIndonesiaIranIraqIrelandIsraelItalyJamaicaJapanJordanKazakhstanKenyaKoreaKuwaitLaosLatin AmericaLatviaLebanonLiberiaLithuaniaMalaysiaMexicoMicronesiaMiddle AfricaMoldovaMoroccoNepalNetherlandsNicaraguaNigeriaNorth AmericaNorth MacedoniaNorthern AfricaNorthern EuropeNorwayOceaniaPakistanPanamaPeruPhilippinesPolandPortugalRomaniaRussiaSaudi ArabiaScotlandSenegalSerbiaSierra LeoneSingaporeSomaliaSouth AfricaSouth AmericaSouth Central AsiaSouth Eastern AsiaSouthern EuropeSpainSri LankaSt. Vincent and the GrenadinesSudanSwedenSwitzerlandSyriaTaiwanThailandTrinidad and TobagoTurkeyUgandaUkraineUruguayUzbekistanVenezuelaVietnamWest IndiesWestern AfricaWestern AsiaWestern EuropeYemenZaireZimbabweAzores
Puget Sound Salish
Race
Ancestry
AfghanAfricanAlaska NativeAlaskan AthabascanAlbanianAleutAlsatianAmericanApacheArabArapahoArgentineanArmenianAssyrian/Chaldean/SyriacAustralianAustrianBahamianBangladeshiBarbadianBasqueBelgianBelizeanBermudanBhutaneseBlackfeetBolivianBrazilianBritishBritish West IndianBulgarianBurmeseCajunCambodianCanadianCape VerdeanCarpatho RusynCelticCentral AmericanCentral American IndianCherokeeCheyenneChickasawChileanChineseChippewaChoctawColombianColvilleComancheCosta RicanCreeCreekCroatianCrowCubanCypriotCzechCzechoslovakianDanishDelawareDominicanDutchDutch West IndianEastern EuropeanEcuadorianEgyptianEnglishEstonianEthiopianEuropeanFijianFilipinoFinnishFrenchFrench American IndianFrench CanadianGermanGerman RussianGhanaianGreekGuamanian/ChamorroGuatemalanGuyaneseHaitianHmongHonduranHopiHoumaHungarianIcelanderIndonesianInupiatIranianIraqiIrishIroquoisIsraeliItalianJamaicanJapaneseJordanianKenyanKiowaKoreanLaotianLatvianLebaneseLiberianLithuanianLumbeeLuxembourgerMacedonianMalaysianMalteseMarshalleseMenomineeMexicanMexican American IndianMongolianMoroccanNative HawaiianNavajoNepaleseNew ZealanderNicaraguanNigerianNorthern EuropeanNorwegianOkinawanOsageOttawaPaiutePakistaniPalestinianPanamanianParaguayanPennsylvania GermanPeruvianPimaPolishPortuguesePotawatomiPuebloPuerto RicanPuget Sound SalishRomanianRussianSalvadoranSamoanScandinavianScotch-IrishScottishSeminoleSenegaleseSerbianShoshoneSierra LeoneanSiouxSlavicSlovakSloveneSomaliSouth AfricanSouth AmericanSouth American IndianSoviet UnionSpaniardSpanishSpanish AmericanSpanish American IndianSri LankanSubsaharan AfricanSudaneseSwedishSwissSyrianTaiwaneseThaiTlingit-HaidaTohono O'OdhamTonganTrinidadian and TobagonianTsimshianTurkishU.S. Virgin IslanderUgandanUkrainianUruguayanUteVenezuelanVietnameseWelshWest IndianYakamaYaquiYugoslavianYumanYup'ikZimbabwean
Immigration
NonimmigrantsImmigrantsAfghanistanAfricaAlbaniaArgentinaArmeniaAsiaAustraliaAustriaBahamasBangladeshBarbadosBelarusBelgiumBelizeBoliviaBosnia and HerzegovinaBrazilBulgariaBurma/MyanmarCabo VerdeCambodiaCameroonCanadaCaribbeanCentral AmericaChileChinaColombiaCongoCosta RicaCroatiaCubaCzechoslovakiaDenmarkDominicaDominican RepublicEastern AfricaEastern AsiaEastern EuropeEcuadorEgyptEl SalvadorEnglandEritreaEthiopiaEuropeFijiFranceGermanyGhanaGreeceGrenadaGuatemalaGuyanaHaitiHondurasHong KongHungaryIndiaIndonesiaIranIraqIrelandIsraelItalyJamaicaJapanJordanKazakhstanKenyaKoreaKuwaitLaosLatin AmericaLatviaLebanonLiberiaLithuaniaMalaysiaMexicoMicronesiaMiddle AfricaMoldovaMoroccoNepalNetherlandsNicaraguaNigeriaNorth AmericaNorth MacedoniaNorthern AfricaNorthern EuropeNorwayOceaniaPakistanPanamaPeruPhilippinesPolandPortugalRomaniaRussiaSaudi ArabiaScotlandSenegalSerbiaSierra LeoneSingaporeSomaliaSouth AfricaSouth AmericaSouth Central AsiaSouth Eastern AsiaSouthern EuropeSpainSri LankaSt. Vincent and the GrenadinesSudanSwedenSwitzerlandSyriaTaiwanThailandTrinidad and TobagoTurkeyUgandaUkraineUruguayUzbekistanVenezuelaVietnamWest IndiesWestern AfricaWestern AsiaWestern EuropeYemenZaireZimbabweAzores
Householder Income Under 25 years
Income
Poverty
Unemployment
Labor Participation
Family Structure
Vehicle Availability
Education Level
Disability

Householder Income Under 25 years Comparison

Indians (Asian)

Puget Sound Salish

Exceptional
Exceptional
$58,239
HOUSEHOLDER INCOME UNDER 25 YEARS
100.0/ 100
METRIC RATING
8th/ 347
METRIC RANK
$55,543
HOUSEHOLDER INCOME UNDER 25 YEARS
100.0/ 100
METRIC RATING
50th/ 347
METRIC RANK

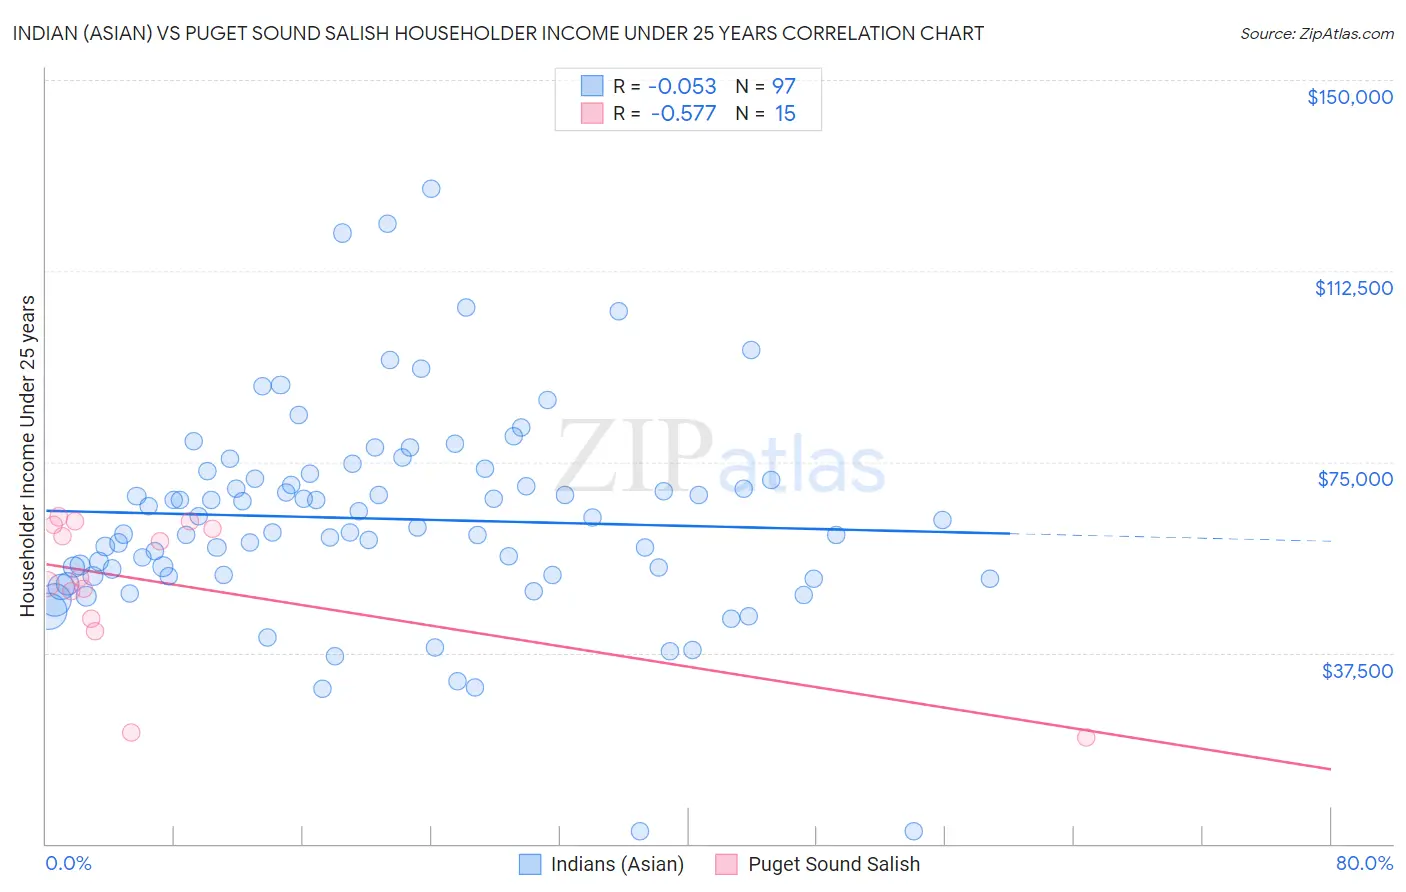
Indian (Asian) vs Puget Sound Salish Householder Income Under 25 years Correlation Chart

The statistical analysis conducted on geographies consisting of 402,539,075 people shows a slight negative correlation between the proportion of Indians (Asian) and household income with householder under the age of 25 in the United States with a correlation coefficient (R) of -0.053 and weighted average of $58,239. Similarly, the statistical analysis conducted on geographies consisting of 43,619,014 people shows a substantial negative correlation between the proportion of Puget Sound Salish and household income with householder under the age of 25 in the United States with a correlation coefficient (R) of -0.577 and weighted average of $55,543, a difference of 4.9%.
Indian (Asian) vs Puget Sound Salish Householder Income Under 25 years

Householder Income Under 25 years Correlation Summary

MeasurementIndian (Asian)Puget Sound Salish
Minimum$2,499$20,833
Maximum$128,558$64,208
Range$126,059$43,375
Mean$63,818$51,133
Median$62,127$52,249
Interquartile 25% (IQ1)$52,606$44,250
Interquartile 75% (IQ3)$72,136$62,601
Interquartile Range (IQR)$19,530$18,351
Standard Deviation (Sample)$20,459$14,105
Standard Deviation (Population)$20,353$13,627

Similar Demographics by Householder Income Under 25 years

Demographics Similar to Indians (Asian) by Householder Income Under 25 years

In terms of householder income under 25 years, the demographic groups most similar to Indians (Asian) are Chinese ($58,162, a difference of 0.13%), Afghan ($58,019, a difference of 0.38%), Bolivian ($58,506, a difference of 0.46%), Immigrants from China ($57,931, a difference of 0.53%), and Immigrants from Philippines ($57,930, a difference of 0.53%).
DemographicsRating | RankHouseholder Income Under 25 years
Assyrians/Chaldeans/Syriacs
100.0
/100
|
#1
Exceptional
$65,329
Immigrants | Hong Kong
100.0
/100
|
#2
Exceptional
$62,083
Immigrants | India
100.0
/100
|
#3
Exceptional
$59,914
Immigrants | Taiwan
100.0
/100
|
#4
Exceptional
$59,424
Immigrants | Bolivia
100.0
/100
|
#5
Exceptional
$59,389
Thais
100.0
/100
|
#6
Exceptional
$59,187
Bolivians
100.0
/100
|
#7
Exceptional
$58,506
Indians (Asian)
100.0
/100
|
#8
Exceptional
$58,239
Chinese
100.0
/100
|
#9
Exceptional
$58,162
Afghans
100.0
/100
|
#10
Exceptional
$58,019
Immigrants | China
100.0
/100
|
#11
Exceptional
$57,931
Immigrants | Philippines
100.0
/100
|
#12
Exceptional
$57,930
Immigrants | South Central Asia
100.0
/100
|
#13
Exceptional
$57,818
Filipinos
100.0
/100
|
#14
Exceptional
$57,740
Koreans
100.0
/100
|
#15
Exceptional
$57,730

Demographics Similar to Puget Sound Salish by Householder Income Under 25 years

In terms of householder income under 25 years, the demographic groups most similar to Puget Sound Salish are Iranian ($55,548, a difference of 0.010%), Immigrants from Vietnam ($55,562, a difference of 0.030%), Immigrants from Romania ($55,522, a difference of 0.040%), Immigrants from Indonesia ($55,521, a difference of 0.040%), and Spanish American Indian ($55,573, a difference of 0.050%).
DemographicsRating | RankHouseholder Income Under 25 years
Immigrants | South Eastern Asia
100.0
/100
|
#43
Exceptional
$55,714
Paraguayans
100.0
/100
|
#44
Exceptional
$55,614
Spanish American Indians
100.0
/100
|
#45
Exceptional
$55,573
Immigrants | Eastern Europe
100.0
/100
|
#46
Exceptional
$55,572
Cambodians
100.0
/100
|
#47
Exceptional
$55,571
Immigrants | Vietnam
100.0
/100
|
#48
Exceptional
$55,562
Iranians
100.0
/100
|
#49
Exceptional
$55,548
Puget Sound Salish
100.0
/100
|
#50
Exceptional
$55,543
Immigrants | Romania
100.0
/100
|
#51
Exceptional
$55,522
Immigrants | Indonesia
100.0
/100
|
#52
Exceptional
$55,521
Immigrants | Poland
100.0
/100
|
#53
Exceptional
$55,474
Sri Lankans
100.0
/100
|
#54
Exceptional
$55,470
Immigrants | Ukraine
100.0
/100
|
#55
Exceptional
$55,447
Salvadorans
100.0
/100
|
#56
Exceptional
$55,412
Soviet Union
100.0
/100
|
#57
Exceptional
$55,340