Indian (Asian) vs Nonimmigrants In Labor Force | Age > 16
COMPARE
Indian (Asian)
Nonimmigrants
In Labor Force | Age > 16
In Labor Force | Age > 16 Comparison
Indians (Asian)
Nonimmigrants
65.5%
IN LABOR FORCE | AGE > 16
89.5/ 100
METRIC RATING
142nd/ 347
METRIC RANK
63.5%
IN LABOR FORCE | AGE > 16
0.0/ 100
METRIC RATING
304th/ 347
METRIC RANK
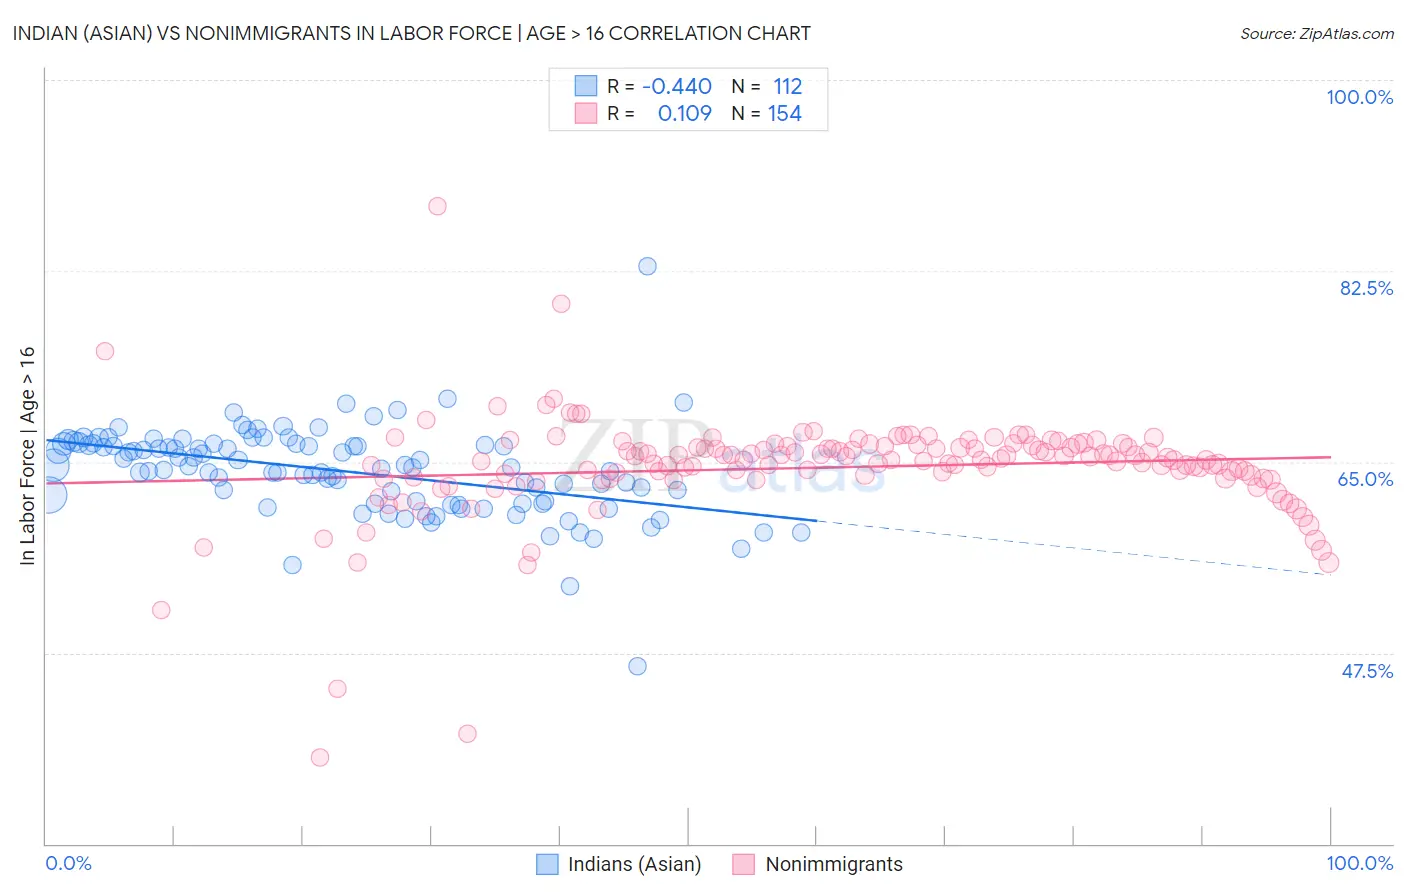
Indian (Asian) vs Nonimmigrants In Labor Force | Age > 16 Correlation Chart
The statistical analysis conducted on geographies consisting of 495,373,057 people shows a moderate negative correlation between the proportion of Indians (Asian) and labor force participation rate among population ages 16 and over in the United States with a correlation coefficient (R) of -0.440 and weighted average of 65.5%. Similarly, the statistical analysis conducted on geographies consisting of 585,341,591 people shows a poor positive correlation between the proportion of Nonimmigrants and labor force participation rate among population ages 16 and over in the United States with a correlation coefficient (R) of 0.109 and weighted average of 63.5%, a difference of 3.2%.
In Labor Force | Age > 16 Correlation Summary
| Measurement | Indian (Asian) | Nonimmigrants |
| Minimum | 46.3% | 37.9% |
| Maximum | 82.9% | 88.4% |
| Range | 36.6% | 50.5% |
| Mean | 64.1% | 64.5% |
| Median | 64.5% | 65.2% |
| Interquartile 25% (IQ1) | 61.3% | 63.5% |
| Interquartile 75% (IQ3) | 66.6% | 66.5% |
| Interquartile Range (IQR) | 5.4% | 3.0% |
| Standard Deviation (Sample) | 4.2% | 5.1% |
| Standard Deviation (Population) | 4.1% | 5.1% |
Similar Demographics by In Labor Force | Age > 16
Demographics Similar to Indians (Asian) by In Labor Force | Age > 16
In terms of in labor force | age > 16, the demographic groups most similar to Indians (Asian) are Latvian (65.5%, a difference of 0.0%), Immigrants from Romania (65.5%, a difference of 0.020%), Samoan (65.5%, a difference of 0.030%), Tlingit-Haida (65.5%, a difference of 0.030%), and Immigrants from Taiwan (65.5%, a difference of 0.040%).
| Demographics | Rating | Rank | In Labor Force | Age > 16 |
| Guatemalans | 92.5 /100 | #135 | Exceptional 65.6% |
| Immigrants | Argentina | 92.4 /100 | #136 | Exceptional 65.6% |
| Guamanians/Chamorros | 92.4 /100 | #137 | Exceptional 65.6% |
| Immigrants | West Indies | 92.0 /100 | #138 | Exceptional 65.6% |
| Immigrants | Taiwan | 90.8 /100 | #139 | Exceptional 65.5% |
| Immigrants | Costa Rica | 90.8 /100 | #140 | Exceptional 65.5% |
| Samoans | 90.5 /100 | #141 | Exceptional 65.5% |
| Indians (Asian) | 89.5 /100 | #142 | Excellent 65.5% |
| Latvians | 89.4 /100 | #143 | Excellent 65.5% |
| Immigrants | Romania | 88.6 /100 | #144 | Excellent 65.5% |
| Tlingit-Haida | 88.3 /100 | #145 | Excellent 65.5% |
| Cypriots | 88.2 /100 | #146 | Excellent 65.5% |
| Immigrants | Oceania | 87.5 /100 | #147 | Excellent 65.5% |
| Bhutanese | 86.3 /100 | #148 | Excellent 65.5% |
| Immigrants | Albania | 85.7 /100 | #149 | Excellent 65.4% |
Demographics Similar to Nonimmigrants by In Labor Force | Age > 16
In terms of in labor force | age > 16, the demographic groups most similar to Nonimmigrants are Cree (63.5%, a difference of 0.050%), Osage (63.5%, a difference of 0.050%), Delaware (63.6%, a difference of 0.090%), Spanish American (63.6%, a difference of 0.11%), and Immigrants from the Azores (63.6%, a difference of 0.13%).
| Demographics | Rating | Rank | In Labor Force | Age > 16 |
| Immigrants | Grenada | 0.0 /100 | #297 | Tragic 63.6% |
| Comanche | 0.0 /100 | #298 | Tragic 63.6% |
| Whites/Caucasians | 0.0 /100 | #299 | Tragic 63.6% |
| Immigrants | Azores | 0.0 /100 | #300 | Tragic 63.6% |
| Spanish Americans | 0.0 /100 | #301 | Tragic 63.6% |
| Delaware | 0.0 /100 | #302 | Tragic 63.6% |
| Cree | 0.0 /100 | #303 | Tragic 63.5% |
| Immigrants | Nonimmigrants | 0.0 /100 | #304 | Tragic 63.5% |
| Osage | 0.0 /100 | #305 | Tragic 63.5% |
| Blacks/African Americans | 0.0 /100 | #306 | Tragic 63.4% |
| Central American Indians | 0.0 /100 | #307 | Tragic 63.4% |
| Pennsylvania Germans | 0.0 /100 | #308 | Tragic 63.4% |
| Scotch-Irish | 0.0 /100 | #309 | Tragic 63.3% |
| Shoshone | 0.0 /100 | #310 | Tragic 63.2% |
| Blackfeet | 0.0 /100 | #311 | Tragic 63.2% |