Immigrants from West Indies vs Houma In Labor Force | Age 35-44
COMPARE
Immigrants from West Indies
Houma
In Labor Force | Age 35-44
In Labor Force | Age 35-44 Comparison
Immigrants from West Indies
Houma
84.3%
IN LABOR FORCE | AGE 35-44
36.4/ 100
METRIC RATING
181st/ 347
METRIC RANK
79.5%
IN LABOR FORCE | AGE 35-44
0.0/ 100
METRIC RATING
331st/ 347
METRIC RANK
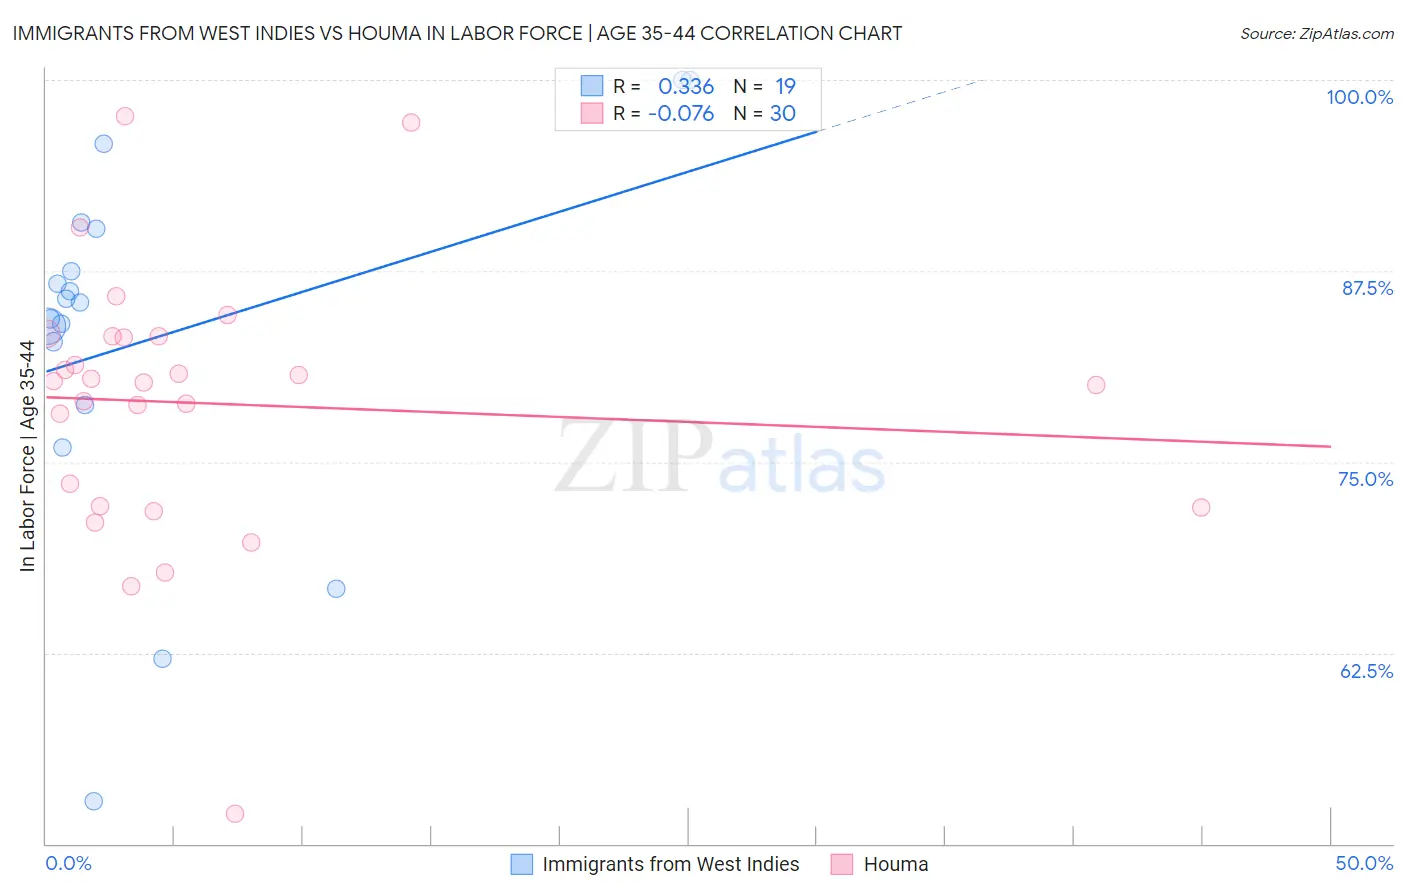
Immigrants from West Indies vs Houma In Labor Force | Age 35-44 Correlation Chart
The statistical analysis conducted on geographies consisting of 72,456,461 people shows a mild positive correlation between the proportion of Immigrants from West Indies and labor force participation rate among population between the ages 35 and 44 in the United States with a correlation coefficient (R) of 0.336 and weighted average of 84.3%. Similarly, the statistical analysis conducted on geographies consisting of 36,793,405 people shows a slight negative correlation between the proportion of Houma and labor force participation rate among population between the ages 35 and 44 in the United States with a correlation coefficient (R) of -0.076 and weighted average of 79.5%, a difference of 6.0%.
In Labor Force | Age 35-44 Correlation Summary
| Measurement | Immigrants from West Indies | Houma |
| Minimum | 52.8% | 52.0% |
| Maximum | 100.0% | 97.6% |
| Range | 47.2% | 45.6% |
| Mean | 83.1% | 78.8% |
| Median | 85.4% | 80.2% |
| Interquartile 25% (IQ1) | 78.7% | 72.1% |
| Interquartile 75% (IQ3) | 90.3% | 83.2% |
| Interquartile Range (IQR) | 11.6% | 11.1% |
| Standard Deviation (Sample) | 12.0% | 8.9% |
| Standard Deviation (Population) | 11.7% | 8.8% |
Similar Demographics by In Labor Force | Age 35-44
Demographics Similar to Immigrants from West Indies by In Labor Force | Age 35-44
In terms of in labor force | age 35-44, the demographic groups most similar to Immigrants from West Indies are Korean (84.3%, a difference of 0.0%), Barbadian (84.3%, a difference of 0.0%), Armenian (84.3%, a difference of 0.010%), Costa Rican (84.3%, a difference of 0.010%), and Australian (84.3%, a difference of 0.010%).
| Demographics | Rating | Rank | In Labor Force | Age 35-44 |
| Immigrants | Iran | 50.0 /100 | #174 | Average 84.4% |
| Pakistanis | 48.2 /100 | #175 | Average 84.4% |
| Sri Lankans | 47.3 /100 | #176 | Average 84.4% |
| French Canadians | 44.3 /100 | #177 | Average 84.3% |
| Northern Europeans | 44.1 /100 | #178 | Average 84.3% |
| Immigrants | South Africa | 42.8 /100 | #179 | Average 84.3% |
| Danes | 38.8 /100 | #180 | Fair 84.3% |
| Immigrants | West Indies | 36.4 /100 | #181 | Fair 84.3% |
| Koreans | 36.3 /100 | #182 | Fair 84.3% |
| Barbadians | 36.2 /100 | #183 | Fair 84.3% |
| Armenians | 35.6 /100 | #184 | Fair 84.3% |
| Costa Ricans | 35.3 /100 | #185 | Fair 84.3% |
| Australians | 35.1 /100 | #186 | Fair 84.3% |
| Dutch | 34.8 /100 | #187 | Fair 84.3% |
| South Africans | 34.1 /100 | #188 | Fair 84.3% |
Demographics Similar to Houma by In Labor Force | Age 35-44
In terms of in labor force | age 35-44, the demographic groups most similar to Houma are Cheyenne (79.5%, a difference of 0.020%), Ute (79.4%, a difference of 0.060%), Menominee (79.7%, a difference of 0.22%), Kiowa (79.2%, a difference of 0.39%), and Creek (80.0%, a difference of 0.66%).
| Demographics | Rating | Rank | In Labor Force | Age 35-44 |
| Choctaw | 0.0 /100 | #324 | Tragic 80.5% |
| Dutch West Indians | 0.0 /100 | #325 | Tragic 80.4% |
| Seminole | 0.0 /100 | #326 | Tragic 80.4% |
| Sioux | 0.0 /100 | #327 | Tragic 80.2% |
| Creek | 0.0 /100 | #328 | Tragic 80.0% |
| Menominee | 0.0 /100 | #329 | Tragic 79.7% |
| Cheyenne | 0.0 /100 | #330 | Tragic 79.5% |
| Houma | 0.0 /100 | #331 | Tragic 79.5% |
| Ute | 0.0 /100 | #332 | Tragic 79.4% |
| Kiowa | 0.0 /100 | #333 | Tragic 79.2% |
| Yakama | 0.0 /100 | #334 | Tragic 79.0% |
| Natives/Alaskans | 0.0 /100 | #335 | Tragic 78.9% |
| Arapaho | 0.0 /100 | #336 | Tragic 78.1% |
| Apache | 0.0 /100 | #337 | Tragic 77.9% |
| Pueblo | 0.0 /100 | #338 | Tragic 77.4% |