Immigrants from West Indies vs U.S. Virgin Islander In Labor Force | Age 35-44
COMPARE
Immigrants from West Indies
U.S. Virgin Islander
In Labor Force | Age 35-44
In Labor Force | Age 35-44 Comparison
Immigrants from West Indies
U.S. Virgin Islanders
84.3%
IN LABOR FORCE | AGE 35-44
36.4/ 100
METRIC RATING
181st/ 347
METRIC RANK
84.0%
IN LABOR FORCE | AGE 35-44
6.1/ 100
METRIC RATING
224th/ 347
METRIC RANK
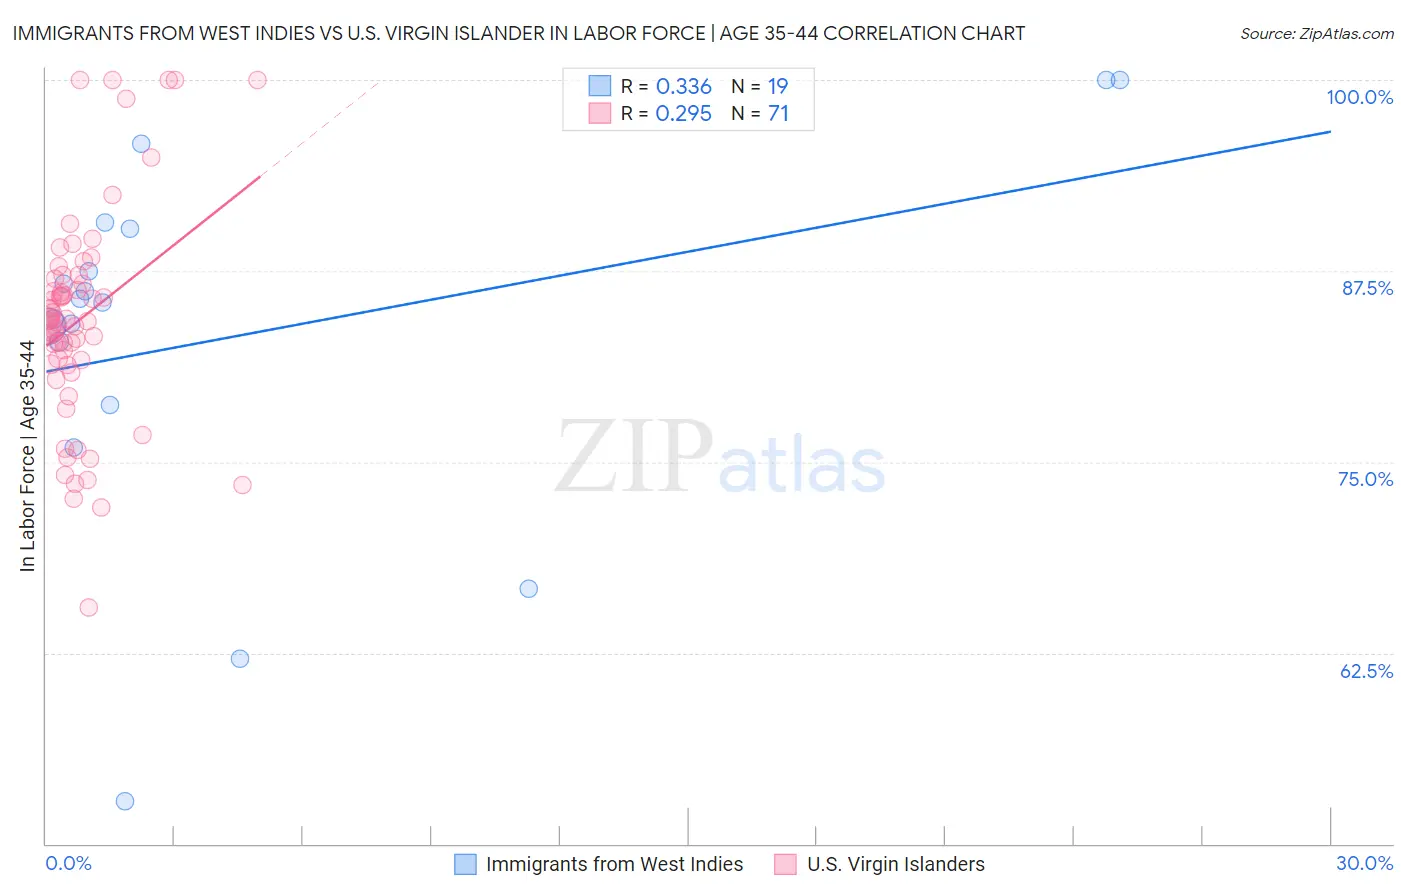
Immigrants from West Indies vs U.S. Virgin Islander In Labor Force | Age 35-44 Correlation Chart
The statistical analysis conducted on geographies consisting of 72,456,461 people shows a mild positive correlation between the proportion of Immigrants from West Indies and labor force participation rate among population between the ages 35 and 44 in the United States with a correlation coefficient (R) of 0.336 and weighted average of 84.3%. Similarly, the statistical analysis conducted on geographies consisting of 87,507,209 people shows a weak positive correlation between the proportion of U.S. Virgin Islanders and labor force participation rate among population between the ages 35 and 44 in the United States with a correlation coefficient (R) of 0.295 and weighted average of 84.0%, a difference of 0.35%.
In Labor Force | Age 35-44 Correlation Summary
| Measurement | Immigrants from West Indies | U.S. Virgin Islander |
| Minimum | 52.8% | 65.5% |
| Maximum | 100.0% | 100.0% |
| Range | 47.2% | 34.5% |
| Mean | 83.1% | 84.3% |
| Median | 85.4% | 84.2% |
| Interquartile 25% (IQ1) | 78.7% | 81.4% |
| Interquartile 75% (IQ3) | 90.3% | 87.0% |
| Interquartile Range (IQR) | 11.6% | 5.6% |
| Standard Deviation (Sample) | 12.0% | 7.0% |
| Standard Deviation (Population) | 11.7% | 6.9% |
Similar Demographics by In Labor Force | Age 35-44
Demographics Similar to Immigrants from West Indies by In Labor Force | Age 35-44
In terms of in labor force | age 35-44, the demographic groups most similar to Immigrants from West Indies are Korean (84.3%, a difference of 0.0%), Barbadian (84.3%, a difference of 0.0%), Armenian (84.3%, a difference of 0.010%), Costa Rican (84.3%, a difference of 0.010%), and Australian (84.3%, a difference of 0.010%).
| Demographics | Rating | Rank | In Labor Force | Age 35-44 |
| Immigrants | Iran | 50.0 /100 | #174 | Average 84.4% |
| Pakistanis | 48.2 /100 | #175 | Average 84.4% |
| Sri Lankans | 47.3 /100 | #176 | Average 84.4% |
| French Canadians | 44.3 /100 | #177 | Average 84.3% |
| Northern Europeans | 44.1 /100 | #178 | Average 84.3% |
| Immigrants | South Africa | 42.8 /100 | #179 | Average 84.3% |
| Danes | 38.8 /100 | #180 | Fair 84.3% |
| Immigrants | West Indies | 36.4 /100 | #181 | Fair 84.3% |
| Koreans | 36.3 /100 | #182 | Fair 84.3% |
| Barbadians | 36.2 /100 | #183 | Fair 84.3% |
| Armenians | 35.6 /100 | #184 | Fair 84.3% |
| Costa Ricans | 35.3 /100 | #185 | Fair 84.3% |
| Australians | 35.1 /100 | #186 | Fair 84.3% |
| Dutch | 34.8 /100 | #187 | Fair 84.3% |
| South Africans | 34.1 /100 | #188 | Fair 84.3% |
Demographics Similar to U.S. Virgin Islanders by In Labor Force | Age 35-44
In terms of in labor force | age 35-44, the demographic groups most similar to U.S. Virgin Islanders are Immigrants from Burma/Myanmar (84.0%, a difference of 0.0%), Assyrian/Chaldean/Syriac (84.0%, a difference of 0.010%), Immigrants from Panama (84.0%, a difference of 0.010%), Icelander (84.0%, a difference of 0.020%), and Panamanian (84.0%, a difference of 0.020%).
| Demographics | Rating | Rank | In Labor Force | Age 35-44 |
| Immigrants | Norway | 11.7 /100 | #217 | Poor 84.1% |
| Immigrants | Nicaragua | 9.4 /100 | #218 | Tragic 84.1% |
| Sub-Saharan Africans | 9.3 /100 | #219 | Tragic 84.1% |
| French | 7.5 /100 | #220 | Tragic 84.0% |
| Icelanders | 6.7 /100 | #221 | Tragic 84.0% |
| Assyrians/Chaldeans/Syriacs | 6.6 /100 | #222 | Tragic 84.0% |
| Immigrants | Panama | 6.4 /100 | #223 | Tragic 84.0% |
| U.S. Virgin Islanders | 6.1 /100 | #224 | Tragic 84.0% |
| Immigrants | Burma/Myanmar | 6.1 /100 | #225 | Tragic 84.0% |
| Panamanians | 5.4 /100 | #226 | Tragic 84.0% |
| British West Indians | 5.3 /100 | #227 | Tragic 84.0% |
| Welsh | 5.3 /100 | #228 | Tragic 84.0% |
| Immigrants | Thailand | 4.7 /100 | #229 | Tragic 84.0% |
| Immigrants | Iraq | 3.7 /100 | #230 | Tragic 83.9% |
| Scottish | 3.2 /100 | #231 | Tragic 83.9% |