Immigrants from West Indies vs Immigrants from Fiji In Labor Force | Age 35-44
COMPARE
Immigrants from West Indies
Immigrants from Fiji
In Labor Force | Age 35-44
In Labor Force | Age 35-44 Comparison
Immigrants from West Indies
Immigrants from Fiji
84.3%
IN LABOR FORCE | AGE 35-44
36.4/ 100
METRIC RATING
181st/ 347
METRIC RANK
83.2%
IN LABOR FORCE | AGE 35-44
0.0/ 100
METRIC RATING
272nd/ 347
METRIC RANK
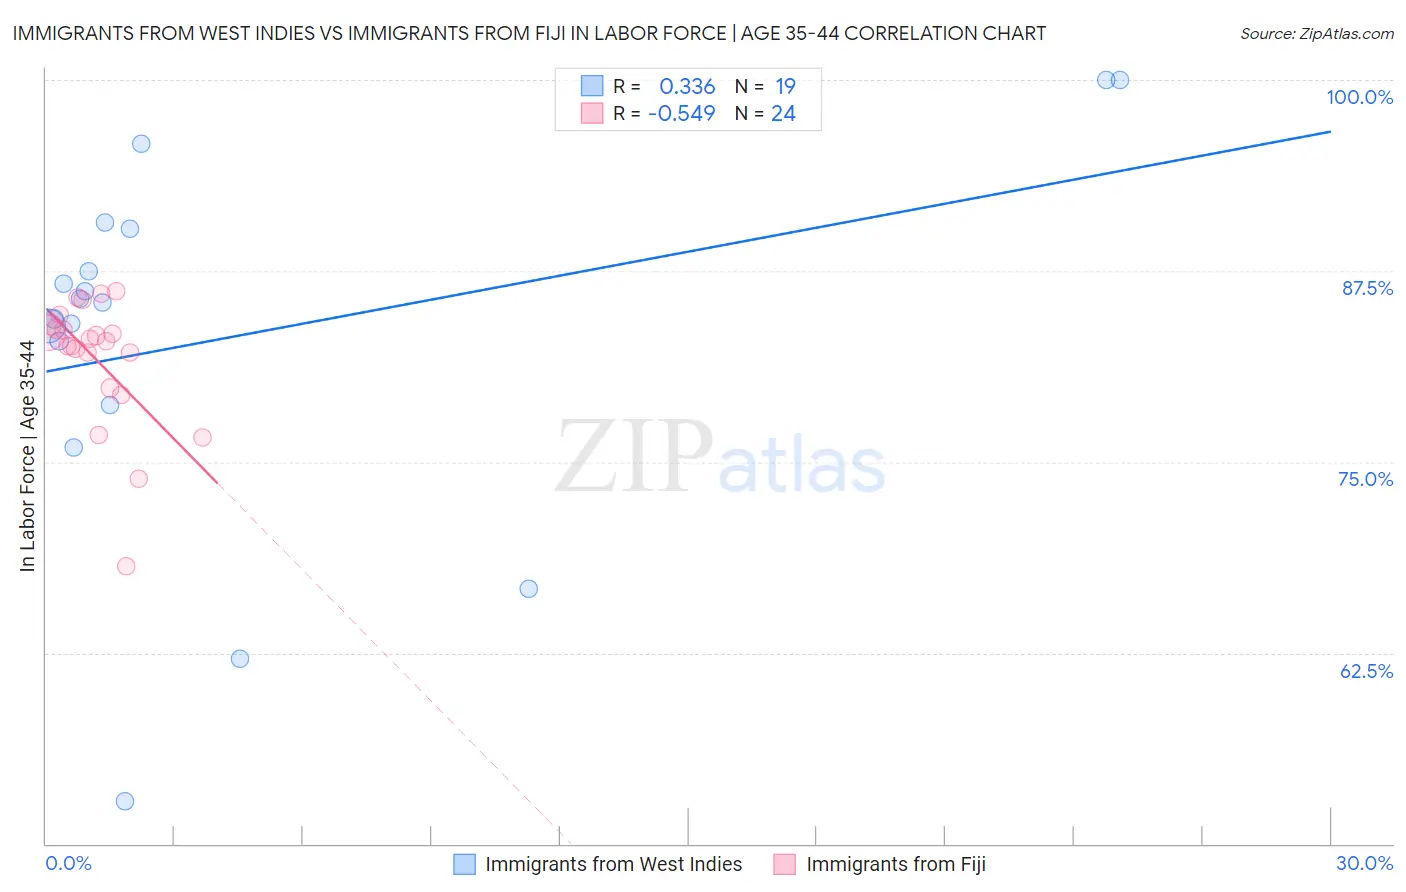
Immigrants from West Indies vs Immigrants from Fiji In Labor Force | Age 35-44 Correlation Chart
The statistical analysis conducted on geographies consisting of 72,456,461 people shows a mild positive correlation between the proportion of Immigrants from West Indies and labor force participation rate among population between the ages 35 and 44 in the United States with a correlation coefficient (R) of 0.336 and weighted average of 84.3%. Similarly, the statistical analysis conducted on geographies consisting of 93,754,712 people shows a substantial negative correlation between the proportion of Immigrants from Fiji and labor force participation rate among population between the ages 35 and 44 in the United States with a correlation coefficient (R) of -0.549 and weighted average of 83.2%, a difference of 1.3%.
In Labor Force | Age 35-44 Correlation Summary
| Measurement | Immigrants from West Indies | Immigrants from Fiji |
| Minimum | 52.8% | 68.2% |
| Maximum | 100.0% | 86.2% |
| Range | 47.2% | 18.0% |
| Mean | 83.1% | 81.8% |
| Median | 85.4% | 83.0% |
| Interquartile 25% (IQ1) | 78.7% | 81.0% |
| Interquartile 75% (IQ3) | 90.3% | 83.8% |
| Interquartile Range (IQR) | 11.6% | 2.8% |
| Standard Deviation (Sample) | 12.0% | 4.2% |
| Standard Deviation (Population) | 11.7% | 4.1% |
Similar Demographics by In Labor Force | Age 35-44
Demographics Similar to Immigrants from West Indies by In Labor Force | Age 35-44
In terms of in labor force | age 35-44, the demographic groups most similar to Immigrants from West Indies are Korean (84.3%, a difference of 0.0%), Barbadian (84.3%, a difference of 0.0%), Armenian (84.3%, a difference of 0.010%), Costa Rican (84.3%, a difference of 0.010%), and Australian (84.3%, a difference of 0.010%).
| Demographics | Rating | Rank | In Labor Force | Age 35-44 |
| Immigrants | Iran | 50.0 /100 | #174 | Average 84.4% |
| Pakistanis | 48.2 /100 | #175 | Average 84.4% |
| Sri Lankans | 47.3 /100 | #176 | Average 84.4% |
| French Canadians | 44.3 /100 | #177 | Average 84.3% |
| Northern Europeans | 44.1 /100 | #178 | Average 84.3% |
| Immigrants | South Africa | 42.8 /100 | #179 | Average 84.3% |
| Danes | 38.8 /100 | #180 | Fair 84.3% |
| Immigrants | West Indies | 36.4 /100 | #181 | Fair 84.3% |
| Koreans | 36.3 /100 | #182 | Fair 84.3% |
| Barbadians | 36.2 /100 | #183 | Fair 84.3% |
| Armenians | 35.6 /100 | #184 | Fair 84.3% |
| Costa Ricans | 35.3 /100 | #185 | Fair 84.3% |
| Australians | 35.1 /100 | #186 | Fair 84.3% |
| Dutch | 34.8 /100 | #187 | Fair 84.3% |
| South Africans | 34.1 /100 | #188 | Fair 84.3% |
Demographics Similar to Immigrants from Fiji by In Labor Force | Age 35-44
In terms of in labor force | age 35-44, the demographic groups most similar to Immigrants from Fiji are Spanish (83.2%, a difference of 0.0%), Immigrants from Honduras (83.3%, a difference of 0.020%), French American Indian (83.2%, a difference of 0.020%), Nonimmigrants (83.2%, a difference of 0.020%), and Hawaiian (83.2%, a difference of 0.030%).
| Demographics | Rating | Rank | In Labor Force | Age 35-44 |
| Central Americans | 0.1 /100 | #265 | Tragic 83.5% |
| Spaniards | 0.1 /100 | #266 | Tragic 83.4% |
| Guamanians/Chamorros | 0.1 /100 | #267 | Tragic 83.4% |
| Hondurans | 0.1 /100 | #268 | Tragic 83.4% |
| Immigrants | Grenada | 0.1 /100 | #269 | Tragic 83.3% |
| Immigrants | Honduras | 0.0 /100 | #270 | Tragic 83.3% |
| French American Indians | 0.0 /100 | #271 | Tragic 83.2% |
| Immigrants | Fiji | 0.0 /100 | #272 | Tragic 83.2% |
| Spanish | 0.0 /100 | #273 | Tragic 83.2% |
| Immigrants | Nonimmigrants | 0.0 /100 | #274 | Tragic 83.2% |
| Hawaiians | 0.0 /100 | #275 | Tragic 83.2% |
| Delaware | 0.0 /100 | #276 | Tragic 83.2% |
| Samoans | 0.0 /100 | #277 | Tragic 83.2% |
| Belizeans | 0.0 /100 | #278 | Tragic 83.1% |
| Immigrants | Micronesia | 0.0 /100 | #279 | Tragic 83.1% |