Immigrants from Colombia vs Houma In Labor Force | Age 35-44
COMPARE
Immigrants from Colombia
Houma
In Labor Force | Age 35-44
In Labor Force | Age 35-44 Comparison
Immigrants from Colombia
Houma
84.9%
IN LABOR FORCE | AGE 35-44
98.3/ 100
METRIC RATING
80th/ 347
METRIC RANK
79.5%
IN LABOR FORCE | AGE 35-44
0.0/ 100
METRIC RATING
331st/ 347
METRIC RANK
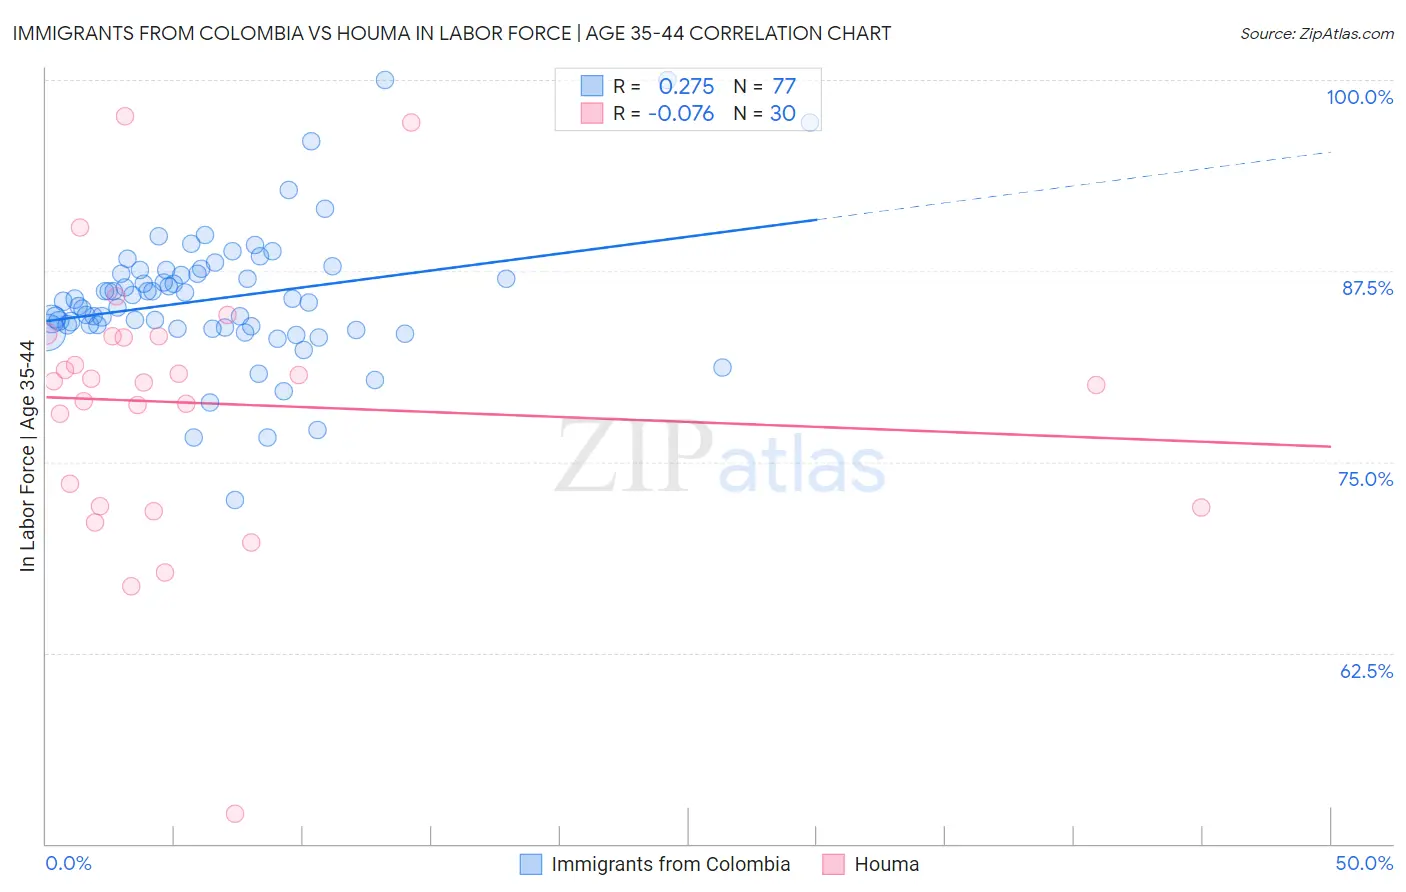
Immigrants from Colombia vs Houma In Labor Force | Age 35-44 Correlation Chart
The statistical analysis conducted on geographies consisting of 378,571,639 people shows a weak positive correlation between the proportion of Immigrants from Colombia and labor force participation rate among population between the ages 35 and 44 in the United States with a correlation coefficient (R) of 0.275 and weighted average of 84.9%. Similarly, the statistical analysis conducted on geographies consisting of 36,793,405 people shows a slight negative correlation between the proportion of Houma and labor force participation rate among population between the ages 35 and 44 in the United States with a correlation coefficient (R) of -0.076 and weighted average of 79.5%, a difference of 6.8%.
In Labor Force | Age 35-44 Correlation Summary
| Measurement | Immigrants from Colombia | Houma |
| Minimum | 72.5% | 52.0% |
| Maximum | 100.0% | 97.6% |
| Range | 27.5% | 45.6% |
| Mean | 85.7% | 78.8% |
| Median | 85.5% | 80.2% |
| Interquartile 25% (IQ1) | 83.8% | 72.1% |
| Interquartile 75% (IQ3) | 87.4% | 83.2% |
| Interquartile Range (IQR) | 3.7% | 11.1% |
| Standard Deviation (Sample) | 4.5% | 8.9% |
| Standard Deviation (Population) | 4.4% | 8.8% |
Similar Demographics by In Labor Force | Age 35-44
Demographics Similar to Immigrants from Colombia by In Labor Force | Age 35-44
In terms of in labor force | age 35-44, the demographic groups most similar to Immigrants from Colombia are Peruvian (84.9%, a difference of 0.0%), Immigrants from Eastern Europe (84.9%, a difference of 0.0%), Immigrants from Africa (84.9%, a difference of 0.010%), Immigrants from Sudan (84.9%, a difference of 0.020%), and Immigrants from Cuba (84.9%, a difference of 0.030%).
| Demographics | Rating | Rank | In Labor Force | Age 35-44 |
| Immigrants | Sri Lanka | 98.9 /100 | #73 | Exceptional 85.0% |
| Colombians | 98.8 /100 | #74 | Exceptional 85.0% |
| Immigrants | South Central Asia | 98.7 /100 | #75 | Exceptional 85.0% |
| Immigrants | Cuba | 98.6 /100 | #76 | Exceptional 84.9% |
| Immigrants | Turkey | 98.6 /100 | #77 | Exceptional 84.9% |
| Immigrants | Africa | 98.4 /100 | #78 | Exceptional 84.9% |
| Peruvians | 98.3 /100 | #79 | Exceptional 84.9% |
| Immigrants | Colombia | 98.3 /100 | #80 | Exceptional 84.9% |
| Immigrants | Eastern Europe | 98.3 /100 | #81 | Exceptional 84.9% |
| Immigrants | Sudan | 98.1 /100 | #82 | Exceptional 84.9% |
| Senegalese | 97.8 /100 | #83 | Exceptional 84.9% |
| Immigrants | Peru | 97.8 /100 | #84 | Exceptional 84.9% |
| Immigrants | Middle Africa | 97.8 /100 | #85 | Exceptional 84.9% |
| Greeks | 97.8 /100 | #86 | Exceptional 84.9% |
| Belgians | 97.7 /100 | #87 | Exceptional 84.9% |
Demographics Similar to Houma by In Labor Force | Age 35-44
In terms of in labor force | age 35-44, the demographic groups most similar to Houma are Cheyenne (79.5%, a difference of 0.020%), Ute (79.4%, a difference of 0.060%), Menominee (79.7%, a difference of 0.22%), Kiowa (79.2%, a difference of 0.39%), and Creek (80.0%, a difference of 0.66%).
| Demographics | Rating | Rank | In Labor Force | Age 35-44 |
| Choctaw | 0.0 /100 | #324 | Tragic 80.5% |
| Dutch West Indians | 0.0 /100 | #325 | Tragic 80.4% |
| Seminole | 0.0 /100 | #326 | Tragic 80.4% |
| Sioux | 0.0 /100 | #327 | Tragic 80.2% |
| Creek | 0.0 /100 | #328 | Tragic 80.0% |
| Menominee | 0.0 /100 | #329 | Tragic 79.7% |
| Cheyenne | 0.0 /100 | #330 | Tragic 79.5% |
| Houma | 0.0 /100 | #331 | Tragic 79.5% |
| Ute | 0.0 /100 | #332 | Tragic 79.4% |
| Kiowa | 0.0 /100 | #333 | Tragic 79.2% |
| Yakama | 0.0 /100 | #334 | Tragic 79.0% |
| Natives/Alaskans | 0.0 /100 | #335 | Tragic 78.9% |
| Arapaho | 0.0 /100 | #336 | Tragic 78.1% |
| Apache | 0.0 /100 | #337 | Tragic 77.9% |
| Pueblo | 0.0 /100 | #338 | Tragic 77.4% |