Icelander vs Houma In Labor Force | Age 35-44
COMPARE
Icelander
Houma
In Labor Force | Age 35-44
In Labor Force | Age 35-44 Comparison
Icelanders
Houma
84.0%
IN LABOR FORCE | AGE 35-44
6.7/ 100
METRIC RATING
221st/ 347
METRIC RANK
79.5%
IN LABOR FORCE | AGE 35-44
0.0/ 100
METRIC RATING
331st/ 347
METRIC RANK
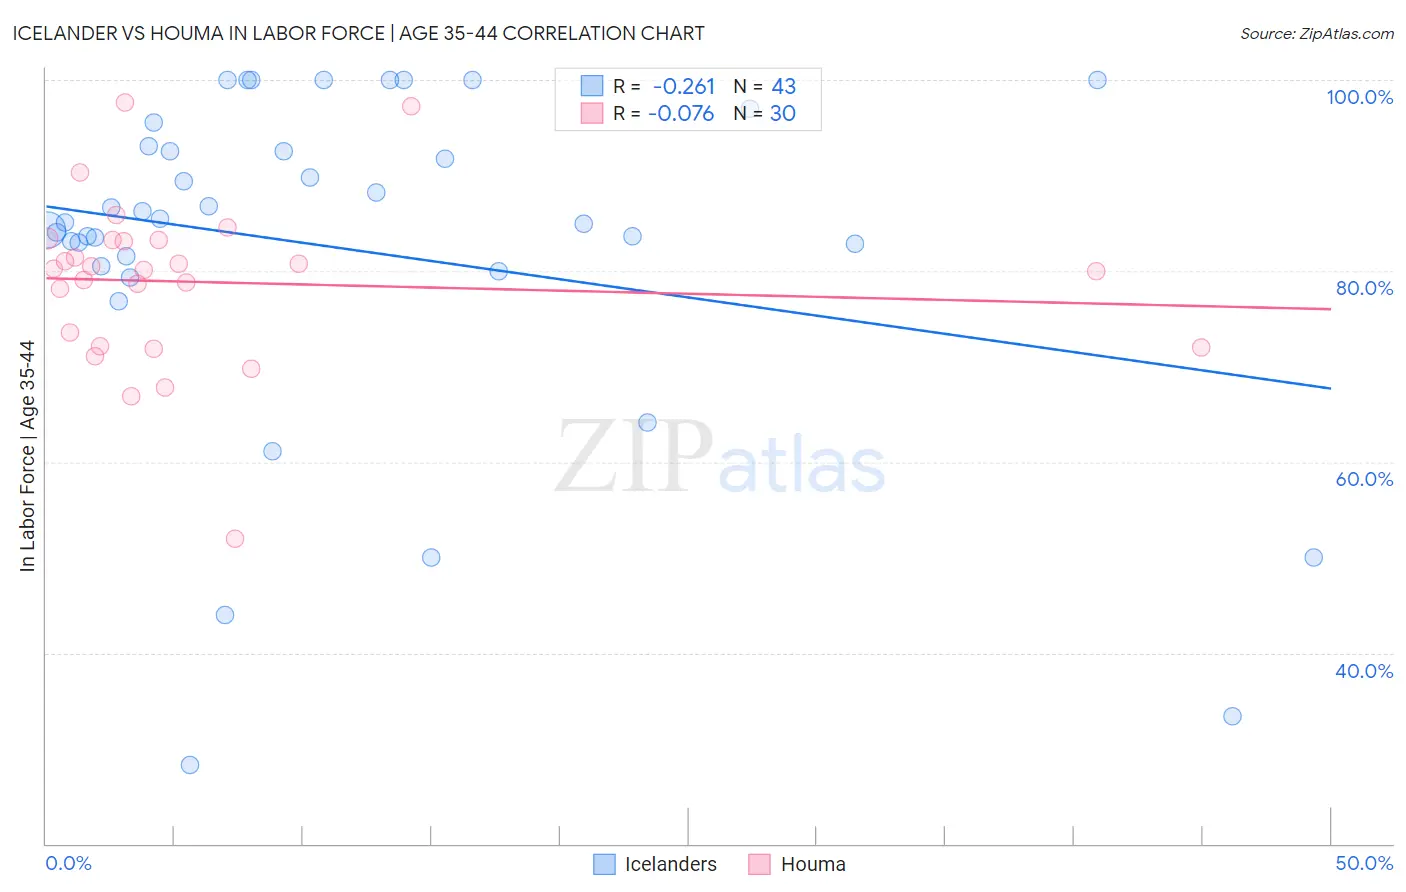
Icelander vs Houma In Labor Force | Age 35-44 Correlation Chart
The statistical analysis conducted on geographies consisting of 159,631,380 people shows a weak negative correlation between the proportion of Icelanders and labor force participation rate among population between the ages 35 and 44 in the United States with a correlation coefficient (R) of -0.261 and weighted average of 84.0%. Similarly, the statistical analysis conducted on geographies consisting of 36,793,405 people shows a slight negative correlation between the proportion of Houma and labor force participation rate among population between the ages 35 and 44 in the United States with a correlation coefficient (R) of -0.076 and weighted average of 79.5%, a difference of 5.7%.
In Labor Force | Age 35-44 Correlation Summary
| Measurement | Icelander | Houma |
| Minimum | 28.2% | 52.0% |
| Maximum | 100.0% | 97.6% |
| Range | 71.8% | 45.6% |
| Mean | 82.4% | 78.8% |
| Median | 85.1% | 80.2% |
| Interquartile 25% (IQ1) | 80.4% | 72.1% |
| Interquartile 75% (IQ3) | 93.1% | 83.2% |
| Interquartile Range (IQR) | 12.7% | 11.1% |
| Standard Deviation (Sample) | 17.8% | 8.9% |
| Standard Deviation (Population) | 17.6% | 8.8% |
Similar Demographics by In Labor Force | Age 35-44
Demographics Similar to Icelanders by In Labor Force | Age 35-44
In terms of in labor force | age 35-44, the demographic groups most similar to Icelanders are Assyrian/Chaldean/Syriac (84.0%, a difference of 0.0%), Immigrants from Panama (84.0%, a difference of 0.010%), French (84.0%, a difference of 0.020%), U.S. Virgin Islander (84.0%, a difference of 0.020%), and Immigrants from Burma/Myanmar (84.0%, a difference of 0.020%).
| Demographics | Rating | Rank | In Labor Force | Age 35-44 |
| Immigrants | Barbados | 13.2 /100 | #214 | Poor 84.1% |
| Europeans | 12.2 /100 | #215 | Poor 84.1% |
| Nicaraguans | 12.1 /100 | #216 | Poor 84.1% |
| Immigrants | Norway | 11.7 /100 | #217 | Poor 84.1% |
| Immigrants | Nicaragua | 9.4 /100 | #218 | Tragic 84.1% |
| Sub-Saharan Africans | 9.3 /100 | #219 | Tragic 84.1% |
| French | 7.5 /100 | #220 | Tragic 84.0% |
| Icelanders | 6.7 /100 | #221 | Tragic 84.0% |
| Assyrians/Chaldeans/Syriacs | 6.6 /100 | #222 | Tragic 84.0% |
| Immigrants | Panama | 6.4 /100 | #223 | Tragic 84.0% |
| U.S. Virgin Islanders | 6.1 /100 | #224 | Tragic 84.0% |
| Immigrants | Burma/Myanmar | 6.1 /100 | #225 | Tragic 84.0% |
| Panamanians | 5.4 /100 | #226 | Tragic 84.0% |
| British West Indians | 5.3 /100 | #227 | Tragic 84.0% |
| Welsh | 5.3 /100 | #228 | Tragic 84.0% |
Demographics Similar to Houma by In Labor Force | Age 35-44
In terms of in labor force | age 35-44, the demographic groups most similar to Houma are Cheyenne (79.5%, a difference of 0.020%), Ute (79.4%, a difference of 0.060%), Menominee (79.7%, a difference of 0.22%), Kiowa (79.2%, a difference of 0.39%), and Creek (80.0%, a difference of 0.66%).
| Demographics | Rating | Rank | In Labor Force | Age 35-44 |
| Choctaw | 0.0 /100 | #324 | Tragic 80.5% |
| Dutch West Indians | 0.0 /100 | #325 | Tragic 80.4% |
| Seminole | 0.0 /100 | #326 | Tragic 80.4% |
| Sioux | 0.0 /100 | #327 | Tragic 80.2% |
| Creek | 0.0 /100 | #328 | Tragic 80.0% |
| Menominee | 0.0 /100 | #329 | Tragic 79.7% |
| Cheyenne | 0.0 /100 | #330 | Tragic 79.5% |
| Houma | 0.0 /100 | #331 | Tragic 79.5% |
| Ute | 0.0 /100 | #332 | Tragic 79.4% |
| Kiowa | 0.0 /100 | #333 | Tragic 79.2% |
| Yakama | 0.0 /100 | #334 | Tragic 79.0% |
| Natives/Alaskans | 0.0 /100 | #335 | Tragic 78.9% |
| Arapaho | 0.0 /100 | #336 | Tragic 78.1% |
| Apache | 0.0 /100 | #337 | Tragic 77.9% |
| Pueblo | 0.0 /100 | #338 | Tragic 77.4% |