Immigrants from West Indies vs Spanish American Indian In Labor Force | Age 35-44
COMPARE
Immigrants from West Indies
Spanish American Indian
In Labor Force | Age 35-44
In Labor Force | Age 35-44 Comparison
Immigrants from West Indies
Spanish American Indians
84.3%
IN LABOR FORCE | AGE 35-44
36.4/ 100
METRIC RATING
181st/ 347
METRIC RANK
82.5%
IN LABOR FORCE | AGE 35-44
0.0/ 100
METRIC RATING
301st/ 347
METRIC RANK
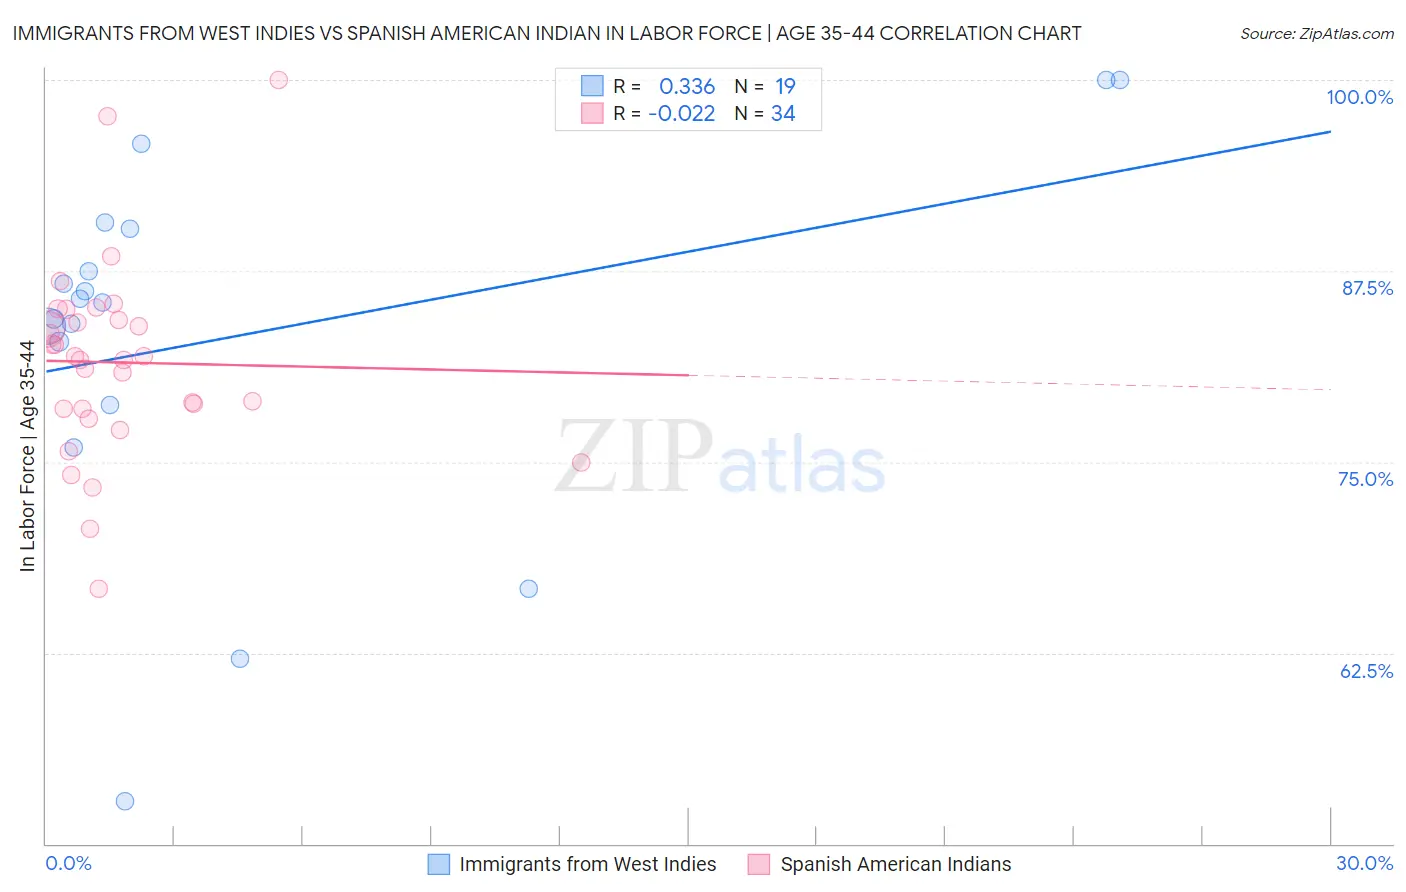
Immigrants from West Indies vs Spanish American Indian In Labor Force | Age 35-44 Correlation Chart
The statistical analysis conducted on geographies consisting of 72,456,461 people shows a mild positive correlation between the proportion of Immigrants from West Indies and labor force participation rate among population between the ages 35 and 44 in the United States with a correlation coefficient (R) of 0.336 and weighted average of 84.3%. Similarly, the statistical analysis conducted on geographies consisting of 73,144,470 people shows no correlation between the proportion of Spanish American Indians and labor force participation rate among population between the ages 35 and 44 in the United States with a correlation coefficient (R) of -0.022 and weighted average of 82.5%, a difference of 2.2%.
In Labor Force | Age 35-44 Correlation Summary
| Measurement | Immigrants from West Indies | Spanish American Indian |
| Minimum | 52.8% | 66.7% |
| Maximum | 100.0% | 100.0% |
| Range | 47.2% | 33.3% |
| Mean | 83.1% | 81.5% |
| Median | 85.4% | 81.8% |
| Interquartile 25% (IQ1) | 78.7% | 78.5% |
| Interquartile 75% (IQ3) | 90.3% | 84.3% |
| Interquartile Range (IQR) | 11.6% | 5.8% |
| Standard Deviation (Sample) | 12.0% | 6.4% |
| Standard Deviation (Population) | 11.7% | 6.3% |
Similar Demographics by In Labor Force | Age 35-44
Demographics Similar to Immigrants from West Indies by In Labor Force | Age 35-44
In terms of in labor force | age 35-44, the demographic groups most similar to Immigrants from West Indies are Korean (84.3%, a difference of 0.0%), Barbadian (84.3%, a difference of 0.0%), Armenian (84.3%, a difference of 0.010%), Costa Rican (84.3%, a difference of 0.010%), and Australian (84.3%, a difference of 0.010%).
| Demographics | Rating | Rank | In Labor Force | Age 35-44 |
| Immigrants | Iran | 50.0 /100 | #174 | Average 84.4% |
| Pakistanis | 48.2 /100 | #175 | Average 84.4% |
| Sri Lankans | 47.3 /100 | #176 | Average 84.4% |
| French Canadians | 44.3 /100 | #177 | Average 84.3% |
| Northern Europeans | 44.1 /100 | #178 | Average 84.3% |
| Immigrants | South Africa | 42.8 /100 | #179 | Average 84.3% |
| Danes | 38.8 /100 | #180 | Fair 84.3% |
| Immigrants | West Indies | 36.4 /100 | #181 | Fair 84.3% |
| Koreans | 36.3 /100 | #182 | Fair 84.3% |
| Barbadians | 36.2 /100 | #183 | Fair 84.3% |
| Armenians | 35.6 /100 | #184 | Fair 84.3% |
| Costa Ricans | 35.3 /100 | #185 | Fair 84.3% |
| Australians | 35.1 /100 | #186 | Fair 84.3% |
| Dutch | 34.8 /100 | #187 | Fair 84.3% |
| South Africans | 34.1 /100 | #188 | Fair 84.3% |
Demographics Similar to Spanish American Indians by In Labor Force | Age 35-44
In terms of in labor force | age 35-44, the demographic groups most similar to Spanish American Indians are Central American Indian (82.5%, a difference of 0.020%), American (82.4%, a difference of 0.080%), Nepalese (82.4%, a difference of 0.080%), Marshallese (82.4%, a difference of 0.080%), and Tlingit-Haida (82.5%, a difference of 0.090%).
| Demographics | Rating | Rank | In Labor Force | Age 35-44 |
| Potawatomi | 0.0 /100 | #294 | Tragic 82.7% |
| Immigrants | Lebanon | 0.0 /100 | #295 | Tragic 82.7% |
| Mexican American Indians | 0.0 /100 | #296 | Tragic 82.6% |
| Hmong | 0.0 /100 | #297 | Tragic 82.6% |
| Ottawa | 0.0 /100 | #298 | Tragic 82.6% |
| Tlingit-Haida | 0.0 /100 | #299 | Tragic 82.5% |
| Central American Indians | 0.0 /100 | #300 | Tragic 82.5% |
| Spanish American Indians | 0.0 /100 | #301 | Tragic 82.5% |
| Americans | 0.0 /100 | #302 | Tragic 82.4% |
| Nepalese | 0.0 /100 | #303 | Tragic 82.4% |
| Marshallese | 0.0 /100 | #304 | Tragic 82.4% |
| Shoshone | 0.0 /100 | #305 | Tragic 82.2% |
| Blacks/African Americans | 0.0 /100 | #306 | Tragic 82.2% |
| Hispanics or Latinos | 0.0 /100 | #307 | Tragic 82.1% |
| Immigrants | Central America | 0.0 /100 | #308 | Tragic 82.0% |