Immigrants from Switzerland vs Basque In Labor Force | Age 16-19
COMPARE
Immigrants from Switzerland
Basque
In Labor Force | Age 16-19
In Labor Force | Age 16-19 Comparison
Immigrants from Switzerland
Basques
35.6%
IN LABOR FORCE | AGE 16-19
11.9/ 100
METRIC RATING
210th/ 347
METRIC RANK
39.3%
IN LABOR FORCE | AGE 16-19
99.7/ 100
METRIC RATING
82nd/ 347
METRIC RANK
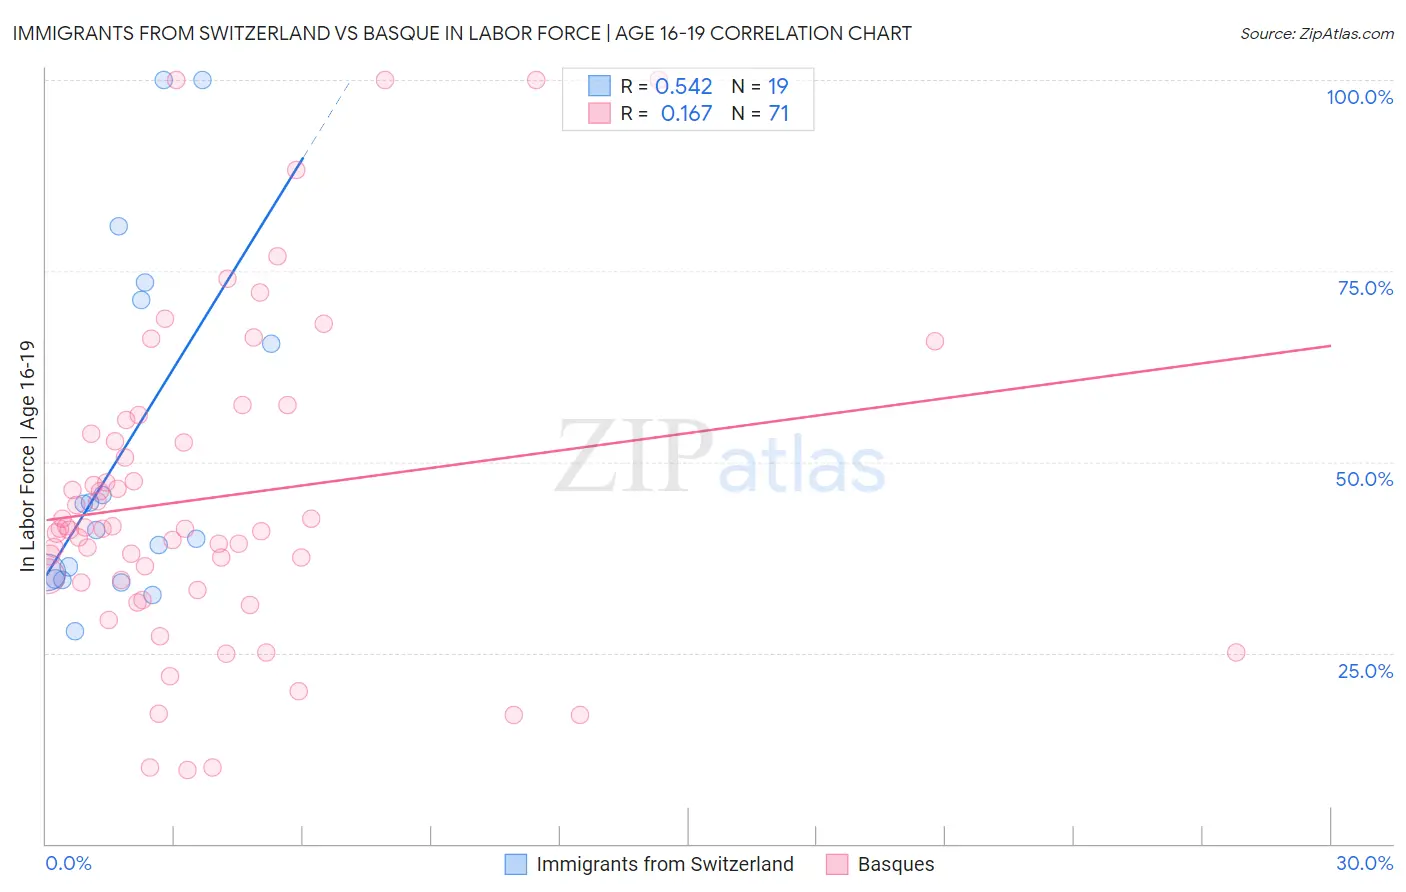
Immigrants from Switzerland vs Basque In Labor Force | Age 16-19 Correlation Chart
The statistical analysis conducted on geographies consisting of 147,934,864 people shows a substantial positive correlation between the proportion of Immigrants from Switzerland and labor force participation rate among population between the ages 16 and 19 in the United States with a correlation coefficient (R) of 0.542 and weighted average of 35.6%. Similarly, the statistical analysis conducted on geographies consisting of 165,637,018 people shows a poor positive correlation between the proportion of Basques and labor force participation rate among population between the ages 16 and 19 in the United States with a correlation coefficient (R) of 0.167 and weighted average of 39.3%, a difference of 10.1%.
In Labor Force | Age 16-19 Correlation Summary
| Measurement | Immigrants from Switzerland | Basque |
| Minimum | 27.7% | 9.7% |
| Maximum | 100.0% | 100.0% |
| Range | 72.3% | 90.3% |
| Mean | 51.7% | 45.3% |
| Median | 41.0% | 41.3% |
| Interquartile 25% (IQ1) | 34.7% | 34.2% |
| Interquartile 75% (IQ3) | 71.2% | 53.7% |
| Interquartile Range (IQR) | 36.5% | 19.5% |
| Standard Deviation (Sample) | 22.9% | 20.8% |
| Standard Deviation (Population) | 22.3% | 20.7% |
Similar Demographics by In Labor Force | Age 16-19
Demographics Similar to Immigrants from Switzerland by In Labor Force | Age 16-19
In terms of in labor force | age 16-19, the demographic groups most similar to Immigrants from Switzerland are Mexican (35.6%, a difference of 0.0%), Moroccan (35.7%, a difference of 0.10%), Houma (35.6%, a difference of 0.11%), Immigrants from Bolivia (35.6%, a difference of 0.11%), and Apache (35.6%, a difference of 0.12%).
| Demographics | Rating | Rank | In Labor Force | Age 16-19 |
| Immigrants | Nigeria | 16.8 /100 | #203 | Poor 35.8% |
| Immigrants | Albania | 15.0 /100 | #204 | Poor 35.8% |
| South American Indians | 14.6 /100 | #205 | Poor 35.8% |
| Chileans | 14.6 /100 | #206 | Poor 35.8% |
| Immigrants | Eastern Europe | 14.5 /100 | #207 | Poor 35.8% |
| Koreans | 13.3 /100 | #208 | Poor 35.7% |
| Moroccans | 12.7 /100 | #209 | Poor 35.7% |
| Immigrants | Switzerland | 11.9 /100 | #210 | Poor 35.6% |
| Mexicans | 11.9 /100 | #211 | Poor 35.6% |
| Houma | 11.0 /100 | #212 | Poor 35.6% |
| Immigrants | Bolivia | 11.0 /100 | #213 | Poor 35.6% |
| Apache | 11.0 /100 | #214 | Poor 35.6% |
| Immigrants | South Eastern Asia | 10.8 /100 | #215 | Poor 35.6% |
| Dutch West Indians | 10.7 /100 | #216 | Poor 35.6% |
| Immigrants | Costa Rica | 10.7 /100 | #217 | Poor 35.6% |
Demographics Similar to Basques by In Labor Force | Age 16-19
In terms of in labor force | age 16-19, the demographic groups most similar to Basques are Spanish (39.3%, a difference of 0.020%), Shoshone (39.3%, a difference of 0.060%), Immigrants from Uganda (39.2%, a difference of 0.15%), Creek (39.1%, a difference of 0.30%), and Samoan (39.1%, a difference of 0.32%).
| Demographics | Rating | Rank | In Labor Force | Age 16-19 |
| French American Indians | 99.9 /100 | #75 | Exceptional 39.8% |
| Malaysians | 99.9 /100 | #76 | Exceptional 39.7% |
| Immigrants | Portugal | 99.9 /100 | #77 | Exceptional 39.7% |
| Austrians | 99.8 /100 | #78 | Exceptional 39.5% |
| Marshallese | 99.8 /100 | #79 | Exceptional 39.5% |
| Immigrants | Iraq | 99.8 /100 | #80 | Exceptional 39.4% |
| Shoshone | 99.7 /100 | #81 | Exceptional 39.3% |
| Basques | 99.7 /100 | #82 | Exceptional 39.3% |
| Spanish | 99.7 /100 | #83 | Exceptional 39.3% |
| Immigrants | Uganda | 99.7 /100 | #84 | Exceptional 39.2% |
| Creek | 99.6 /100 | #85 | Exceptional 39.1% |
| Samoans | 99.6 /100 | #86 | Exceptional 39.1% |
| Immigrants | Germany | 99.6 /100 | #87 | Exceptional 39.1% |
| Puget Sound Salish | 99.6 /100 | #88 | Exceptional 39.1% |
| Alaska Natives | 99.6 /100 | #89 | Exceptional 39.1% |