Immigrants from Eritrea vs Basque In Labor Force | Age 16-19
COMPARE
Immigrants from Eritrea
Basque
In Labor Force | Age 16-19
In Labor Force | Age 16-19 Comparison
Immigrants from Eritrea
Basques
38.7%
IN LABOR FORCE | AGE 16-19
99.0/ 100
METRIC RATING
104th/ 347
METRIC RANK
39.3%
IN LABOR FORCE | AGE 16-19
99.7/ 100
METRIC RATING
82nd/ 347
METRIC RANK
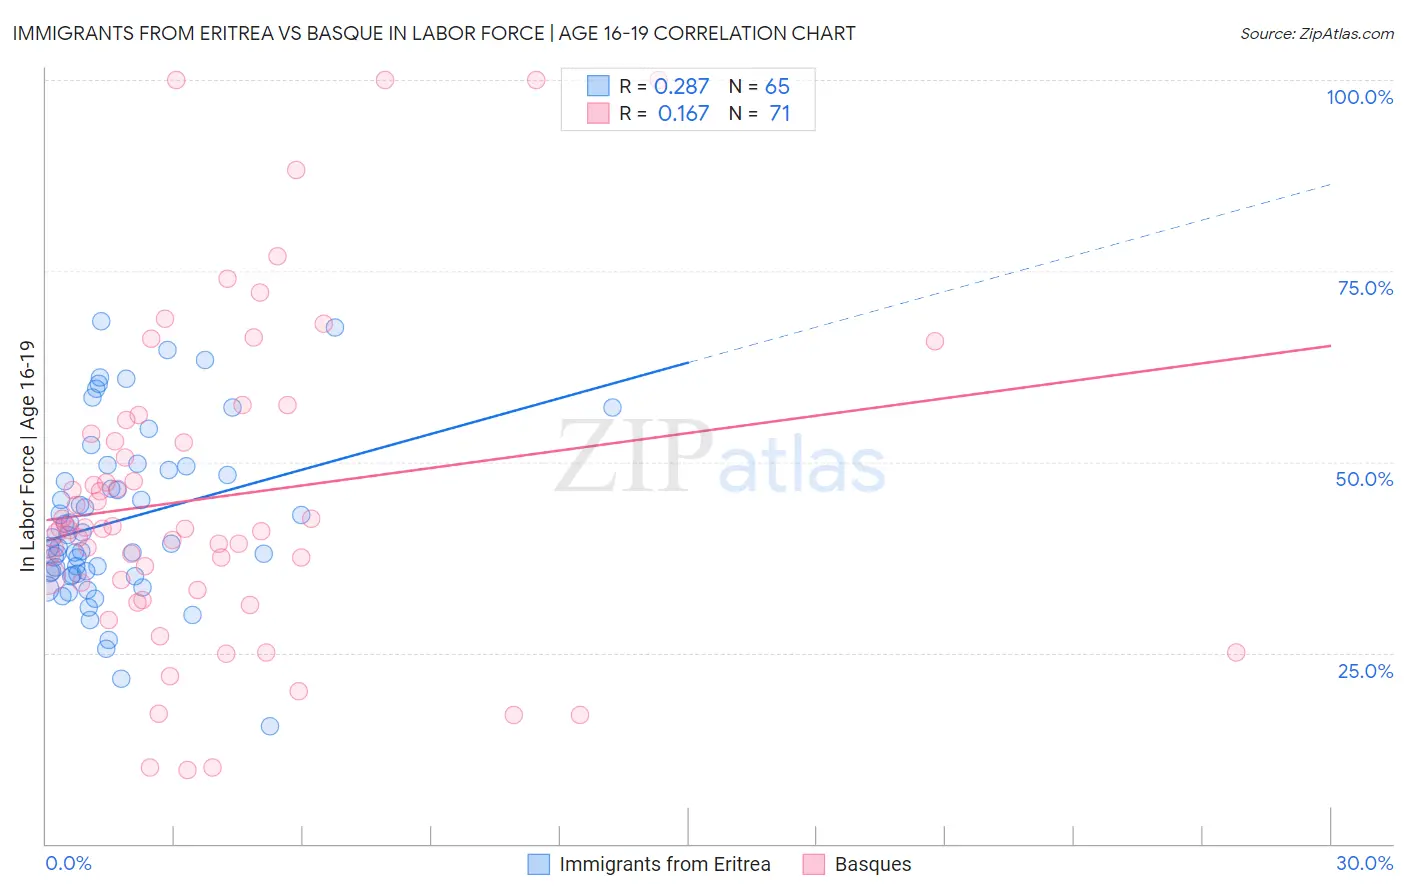
Immigrants from Eritrea vs Basque In Labor Force | Age 16-19 Correlation Chart
The statistical analysis conducted on geographies consisting of 104,843,634 people shows a weak positive correlation between the proportion of Immigrants from Eritrea and labor force participation rate among population between the ages 16 and 19 in the United States with a correlation coefficient (R) of 0.287 and weighted average of 38.7%. Similarly, the statistical analysis conducted on geographies consisting of 165,637,018 people shows a poor positive correlation between the proportion of Basques and labor force participation rate among population between the ages 16 and 19 in the United States with a correlation coefficient (R) of 0.167 and weighted average of 39.3%, a difference of 1.5%.
In Labor Force | Age 16-19 Correlation Summary
| Measurement | Immigrants from Eritrea | Basque |
| Minimum | 15.4% | 9.7% |
| Maximum | 68.4% | 100.0% |
| Range | 53.0% | 90.3% |
| Mean | 42.4% | 45.3% |
| Median | 39.2% | 41.3% |
| Interquartile 25% (IQ1) | 35.3% | 34.2% |
| Interquartile 75% (IQ3) | 49.1% | 53.7% |
| Interquartile Range (IQR) | 13.9% | 19.5% |
| Standard Deviation (Sample) | 11.3% | 20.8% |
| Standard Deviation (Population) | 11.2% | 20.7% |
Similar Demographics by In Labor Force | Age 16-19
Demographics Similar to Immigrants from Eritrea by In Labor Force | Age 16-19
In terms of in labor force | age 16-19, the demographic groups most similar to Immigrants from Eritrea are Immigrants from Cameroon (38.7%, a difference of 0.050%), Hmong (38.7%, a difference of 0.090%), Zimbabwean (38.7%, a difference of 0.090%), Immigrants from Thailand (38.7%, a difference of 0.16%), and Iraqi (38.6%, a difference of 0.16%).
| Demographics | Rating | Rank | In Labor Force | Age 16-19 |
| Greeks | 99.3 /100 | #97 | Exceptional 38.9% |
| Ugandans | 99.3 /100 | #98 | Exceptional 38.9% |
| Immigrants | North Macedonia | 99.3 /100 | #99 | Exceptional 38.9% |
| Immigrants | Thailand | 99.1 /100 | #100 | Exceptional 38.7% |
| Hmong | 99.1 /100 | #101 | Exceptional 38.7% |
| Zimbabweans | 99.1 /100 | #102 | Exceptional 38.7% |
| Immigrants | Cameroon | 99.0 /100 | #103 | Exceptional 38.7% |
| Immigrants | Eritrea | 99.0 /100 | #104 | Exceptional 38.7% |
| Iraqis | 98.9 /100 | #105 | Exceptional 38.6% |
| Delaware | 98.8 /100 | #106 | Exceptional 38.6% |
| Chinese | 98.8 /100 | #107 | Exceptional 38.6% |
| Immigrants | Ethiopia | 98.7 /100 | #108 | Exceptional 38.6% |
| Lebanese | 98.7 /100 | #109 | Exceptional 38.6% |
| Maltese | 98.6 /100 | #110 | Exceptional 38.5% |
| Crow | 98.5 /100 | #111 | Exceptional 38.5% |
Demographics Similar to Basques by In Labor Force | Age 16-19
In terms of in labor force | age 16-19, the demographic groups most similar to Basques are Spanish (39.3%, a difference of 0.020%), Shoshone (39.3%, a difference of 0.060%), Immigrants from Uganda (39.2%, a difference of 0.15%), Creek (39.1%, a difference of 0.30%), and Samoan (39.1%, a difference of 0.32%).
| Demographics | Rating | Rank | In Labor Force | Age 16-19 |
| French American Indians | 99.9 /100 | #75 | Exceptional 39.8% |
| Malaysians | 99.9 /100 | #76 | Exceptional 39.7% |
| Immigrants | Portugal | 99.9 /100 | #77 | Exceptional 39.7% |
| Austrians | 99.8 /100 | #78 | Exceptional 39.5% |
| Marshallese | 99.8 /100 | #79 | Exceptional 39.5% |
| Immigrants | Iraq | 99.8 /100 | #80 | Exceptional 39.4% |
| Shoshone | 99.7 /100 | #81 | Exceptional 39.3% |
| Basques | 99.7 /100 | #82 | Exceptional 39.3% |
| Spanish | 99.7 /100 | #83 | Exceptional 39.3% |
| Immigrants | Uganda | 99.7 /100 | #84 | Exceptional 39.2% |
| Creek | 99.6 /100 | #85 | Exceptional 39.1% |
| Samoans | 99.6 /100 | #86 | Exceptional 39.1% |
| Immigrants | Germany | 99.6 /100 | #87 | Exceptional 39.1% |
| Puget Sound Salish | 99.6 /100 | #88 | Exceptional 39.1% |
| Alaska Natives | 99.6 /100 | #89 | Exceptional 39.1% |