Swiss vs Basque In Labor Force | Age 16-19
COMPARE
Swiss
Basque
In Labor Force | Age 16-19
In Labor Force | Age 16-19 Comparison
Swiss
Basques
43.3%
IN LABOR FORCE | AGE 16-19
100.0/ 100
METRIC RATING
20th/ 347
METRIC RANK
39.3%
IN LABOR FORCE | AGE 16-19
99.7/ 100
METRIC RATING
82nd/ 347
METRIC RANK
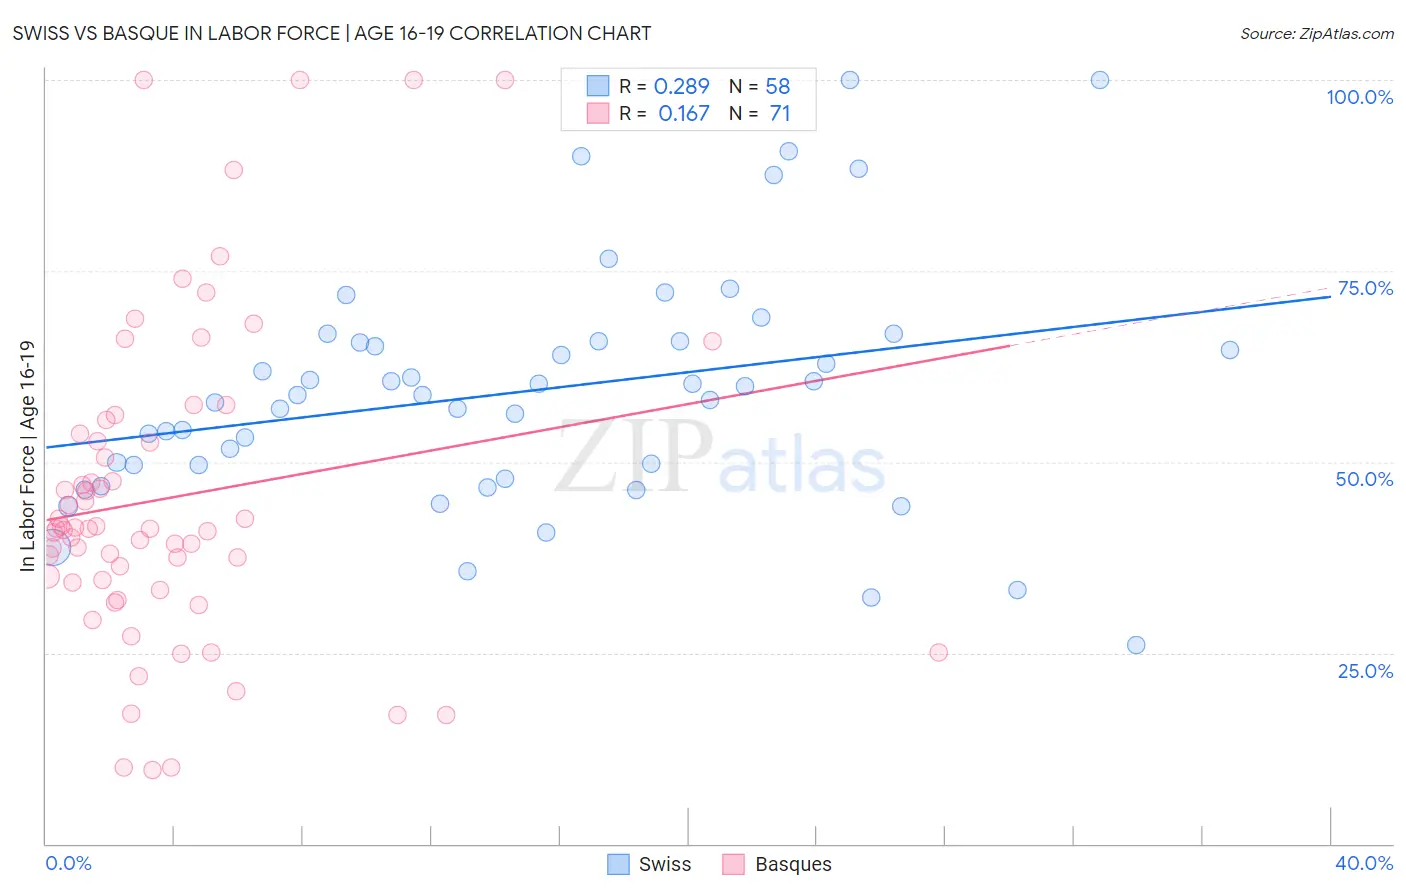
Swiss vs Basque In Labor Force | Age 16-19 Correlation Chart
The statistical analysis conducted on geographies consisting of 463,664,152 people shows a weak positive correlation between the proportion of Swiss and labor force participation rate among population between the ages 16 and 19 in the United States with a correlation coefficient (R) of 0.289 and weighted average of 43.3%. Similarly, the statistical analysis conducted on geographies consisting of 165,637,018 people shows a poor positive correlation between the proportion of Basques and labor force participation rate among population between the ages 16 and 19 in the United States with a correlation coefficient (R) of 0.167 and weighted average of 39.3%, a difference of 10.2%.
In Labor Force | Age 16-19 Correlation Summary
| Measurement | Swiss | Basque |
| Minimum | 26.1% | 9.7% |
| Maximum | 100.0% | 100.0% |
| Range | 73.9% | 90.3% |
| Mean | 59.2% | 45.3% |
| Median | 58.8% | 41.3% |
| Interquartile 25% (IQ1) | 49.5% | 34.2% |
| Interquartile 75% (IQ3) | 65.8% | 53.7% |
| Interquartile Range (IQR) | 16.3% | 19.5% |
| Standard Deviation (Sample) | 15.7% | 20.8% |
| Standard Deviation (Population) | 15.5% | 20.7% |
Similar Demographics by In Labor Force | Age 16-19
Demographics Similar to Swiss by In Labor Force | Age 16-19
In terms of in labor force | age 16-19, the demographic groups most similar to Swiss are Belgian (43.4%, a difference of 0.22%), Ottawa (43.0%, a difference of 0.56%), French Canadian (43.6%, a difference of 0.73%), Scandinavian (43.6%, a difference of 0.80%), and Czech (43.6%, a difference of 0.87%).
| Demographics | Rating | Rank | In Labor Force | Age 16-19 |
| Dutch | 100.0 /100 | #13 | Exceptional 43.8% |
| Chippewa | 100.0 /100 | #14 | Exceptional 43.8% |
| Slovenes | 100.0 /100 | #15 | Exceptional 43.7% |
| Czechs | 100.0 /100 | #16 | Exceptional 43.6% |
| Scandinavians | 100.0 /100 | #17 | Exceptional 43.6% |
| French Canadians | 100.0 /100 | #18 | Exceptional 43.6% |
| Belgians | 100.0 /100 | #19 | Exceptional 43.4% |
| Swiss | 100.0 /100 | #20 | Exceptional 43.3% |
| Ottawa | 100.0 /100 | #21 | Exceptional 43.0% |
| Sudanese | 100.0 /100 | #22 | Exceptional 42.9% |
| Slovaks | 100.0 /100 | #23 | Exceptional 42.6% |
| Bangladeshis | 100.0 /100 | #24 | Exceptional 42.5% |
| German Russians | 100.0 /100 | #25 | Exceptional 42.4% |
| English | 100.0 /100 | #26 | Exceptional 42.4% |
| Welsh | 100.0 /100 | #27 | Exceptional 42.3% |
Demographics Similar to Basques by In Labor Force | Age 16-19
In terms of in labor force | age 16-19, the demographic groups most similar to Basques are Spanish (39.3%, a difference of 0.020%), Shoshone (39.3%, a difference of 0.060%), Immigrants from Uganda (39.2%, a difference of 0.15%), Creek (39.1%, a difference of 0.30%), and Samoan (39.1%, a difference of 0.32%).
| Demographics | Rating | Rank | In Labor Force | Age 16-19 |
| French American Indians | 99.9 /100 | #75 | Exceptional 39.8% |
| Malaysians | 99.9 /100 | #76 | Exceptional 39.7% |
| Immigrants | Portugal | 99.9 /100 | #77 | Exceptional 39.7% |
| Austrians | 99.8 /100 | #78 | Exceptional 39.5% |
| Marshallese | 99.8 /100 | #79 | Exceptional 39.5% |
| Immigrants | Iraq | 99.8 /100 | #80 | Exceptional 39.4% |
| Shoshone | 99.7 /100 | #81 | Exceptional 39.3% |
| Basques | 99.7 /100 | #82 | Exceptional 39.3% |
| Spanish | 99.7 /100 | #83 | Exceptional 39.3% |
| Immigrants | Uganda | 99.7 /100 | #84 | Exceptional 39.2% |
| Creek | 99.6 /100 | #85 | Exceptional 39.1% |
| Samoans | 99.6 /100 | #86 | Exceptional 39.1% |
| Immigrants | Germany | 99.6 /100 | #87 | Exceptional 39.1% |
| Puget Sound Salish | 99.6 /100 | #88 | Exceptional 39.1% |
| Alaska Natives | 99.6 /100 | #89 | Exceptional 39.1% |