Cajun vs Basque In Labor Force | Age 16-19
COMPARE
Cajun
Basque
In Labor Force | Age 16-19
In Labor Force | Age 16-19 Comparison
Cajuns
Basques
37.8%
IN LABOR FORCE | AGE 16-19
93.2/ 100
METRIC RATING
137th/ 347
METRIC RANK
39.3%
IN LABOR FORCE | AGE 16-19
99.7/ 100
METRIC RATING
82nd/ 347
METRIC RANK
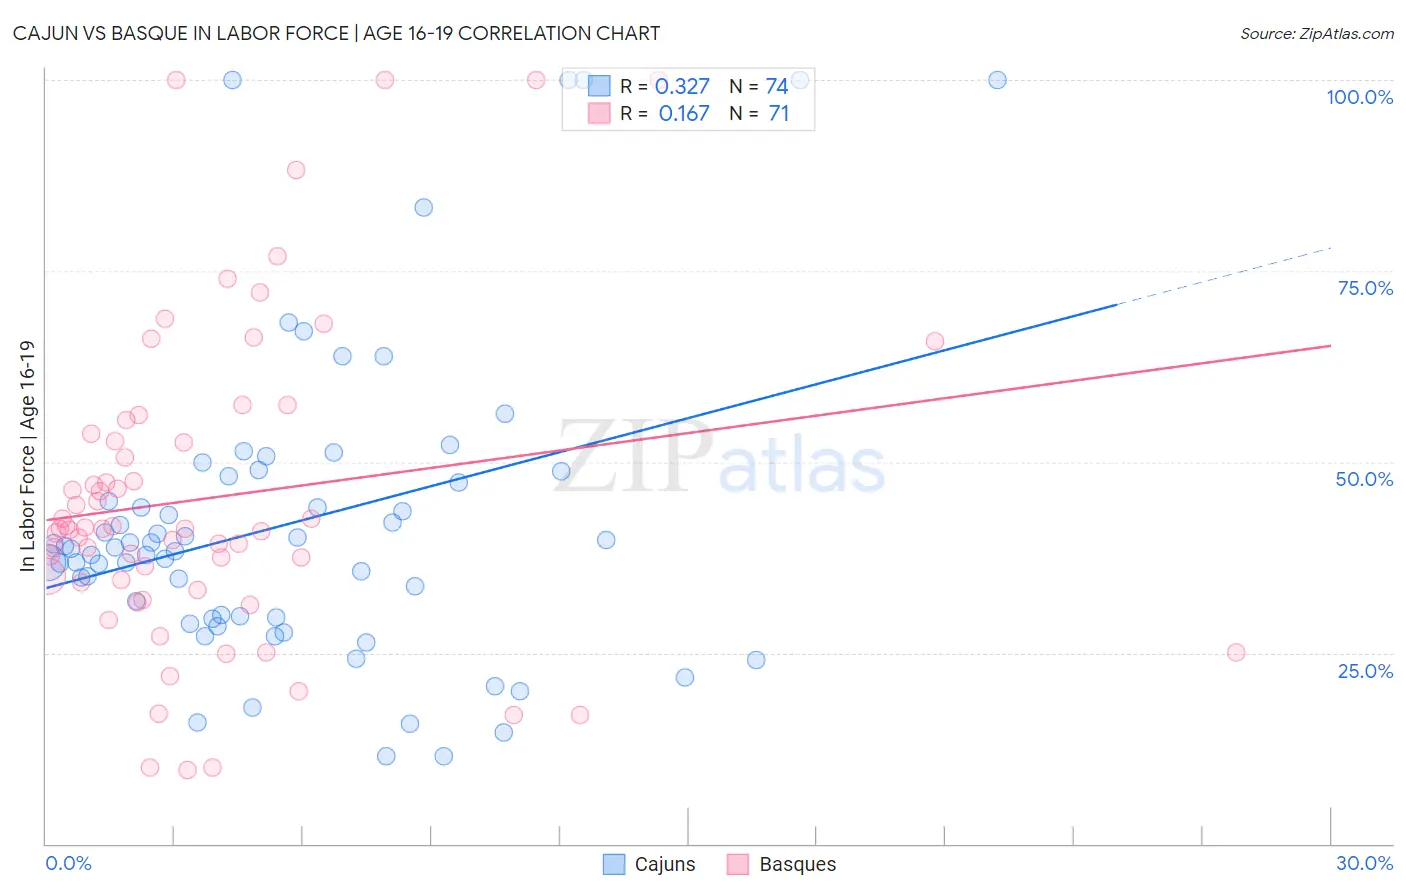
Cajun vs Basque In Labor Force | Age 16-19 Correlation Chart
The statistical analysis conducted on geographies consisting of 149,548,332 people shows a mild positive correlation between the proportion of Cajuns and labor force participation rate among population between the ages 16 and 19 in the United States with a correlation coefficient (R) of 0.327 and weighted average of 37.8%. Similarly, the statistical analysis conducted on geographies consisting of 165,637,018 people shows a poor positive correlation between the proportion of Basques and labor force participation rate among population between the ages 16 and 19 in the United States with a correlation coefficient (R) of 0.167 and weighted average of 39.3%, a difference of 3.9%.
In Labor Force | Age 16-19 Correlation Summary
| Measurement | Cajun | Basque |
| Minimum | 11.5% | 9.7% |
| Maximum | 100.0% | 100.0% |
| Range | 88.5% | 90.3% |
| Mean | 42.1% | 45.3% |
| Median | 38.7% | 41.3% |
| Interquartile 25% (IQ1) | 29.6% | 34.2% |
| Interquartile 75% (IQ3) | 48.1% | 53.7% |
| Interquartile Range (IQR) | 18.5% | 19.5% |
| Standard Deviation (Sample) | 20.5% | 20.8% |
| Standard Deviation (Population) | 20.3% | 20.7% |
Similar Demographics by In Labor Force | Age 16-19
Demographics Similar to Cajuns by In Labor Force | Age 16-19
In terms of in labor force | age 16-19, the demographic groups most similar to Cajuns are Australian (37.8%, a difference of 0.0%), Macedonian (37.8%, a difference of 0.030%), Immigrants from Netherlands (37.8%, a difference of 0.090%), Comanche (37.7%, a difference of 0.23%), and Immigrants from Moldova (37.7%, a difference of 0.24%).
| Demographics | Rating | Rank | In Labor Force | Age 16-19 |
| Immigrants | Zimbabwe | 95.4 /100 | #130 | Exceptional 38.0% |
| Immigrants | Austria | 95.0 /100 | #131 | Exceptional 37.9% |
| Immigrants | Oceania | 94.7 /100 | #132 | Exceptional 37.9% |
| Cheyenne | 94.6 /100 | #133 | Exceptional 37.9% |
| Immigrants | Netherlands | 93.7 /100 | #134 | Exceptional 37.8% |
| Macedonians | 93.4 /100 | #135 | Exceptional 37.8% |
| Australians | 93.2 /100 | #136 | Exceptional 37.8% |
| Cajuns | 93.2 /100 | #137 | Exceptional 37.8% |
| Comanche | 91.9 /100 | #138 | Exceptional 37.7% |
| Immigrants | Moldova | 91.9 /100 | #139 | Exceptional 37.7% |
| Estonians | 91.7 /100 | #140 | Exceptional 37.7% |
| Syrians | 90.7 /100 | #141 | Exceptional 37.6% |
| Sierra Leoneans | 89.7 /100 | #142 | Excellent 37.6% |
| Pakistanis | 89.5 /100 | #143 | Excellent 37.6% |
| Japanese | 89.3 /100 | #144 | Excellent 37.5% |
Demographics Similar to Basques by In Labor Force | Age 16-19
In terms of in labor force | age 16-19, the demographic groups most similar to Basques are Spanish (39.3%, a difference of 0.020%), Shoshone (39.3%, a difference of 0.060%), Immigrants from Uganda (39.2%, a difference of 0.15%), Creek (39.1%, a difference of 0.30%), and Samoan (39.1%, a difference of 0.32%).
| Demographics | Rating | Rank | In Labor Force | Age 16-19 |
| French American Indians | 99.9 /100 | #75 | Exceptional 39.8% |
| Malaysians | 99.9 /100 | #76 | Exceptional 39.7% |
| Immigrants | Portugal | 99.9 /100 | #77 | Exceptional 39.7% |
| Austrians | 99.8 /100 | #78 | Exceptional 39.5% |
| Marshallese | 99.8 /100 | #79 | Exceptional 39.5% |
| Immigrants | Iraq | 99.8 /100 | #80 | Exceptional 39.4% |
| Shoshone | 99.7 /100 | #81 | Exceptional 39.3% |
| Basques | 99.7 /100 | #82 | Exceptional 39.3% |
| Spanish | 99.7 /100 | #83 | Exceptional 39.3% |
| Immigrants | Uganda | 99.7 /100 | #84 | Exceptional 39.2% |
| Creek | 99.6 /100 | #85 | Exceptional 39.1% |
| Samoans | 99.6 /100 | #86 | Exceptional 39.1% |
| Immigrants | Germany | 99.6 /100 | #87 | Exceptional 39.1% |
| Puget Sound Salish | 99.6 /100 | #88 | Exceptional 39.1% |
| Alaska Natives | 99.6 /100 | #89 | Exceptional 39.1% |