Immigrants from Switzerland vs Immigrants from Malaysia In Labor Force | Age 16-19
COMPARE
Immigrants from Switzerland
Immigrants from Malaysia
In Labor Force | Age 16-19
In Labor Force | Age 16-19 Comparison
Immigrants from Switzerland
Immigrants from Malaysia
35.6%
IN LABOR FORCE | AGE 16-19
11.9/ 100
METRIC RATING
210th/ 347
METRIC RANK
34.3%
IN LABOR FORCE | AGE 16-19
0.7/ 100
METRIC RATING
266th/ 347
METRIC RANK
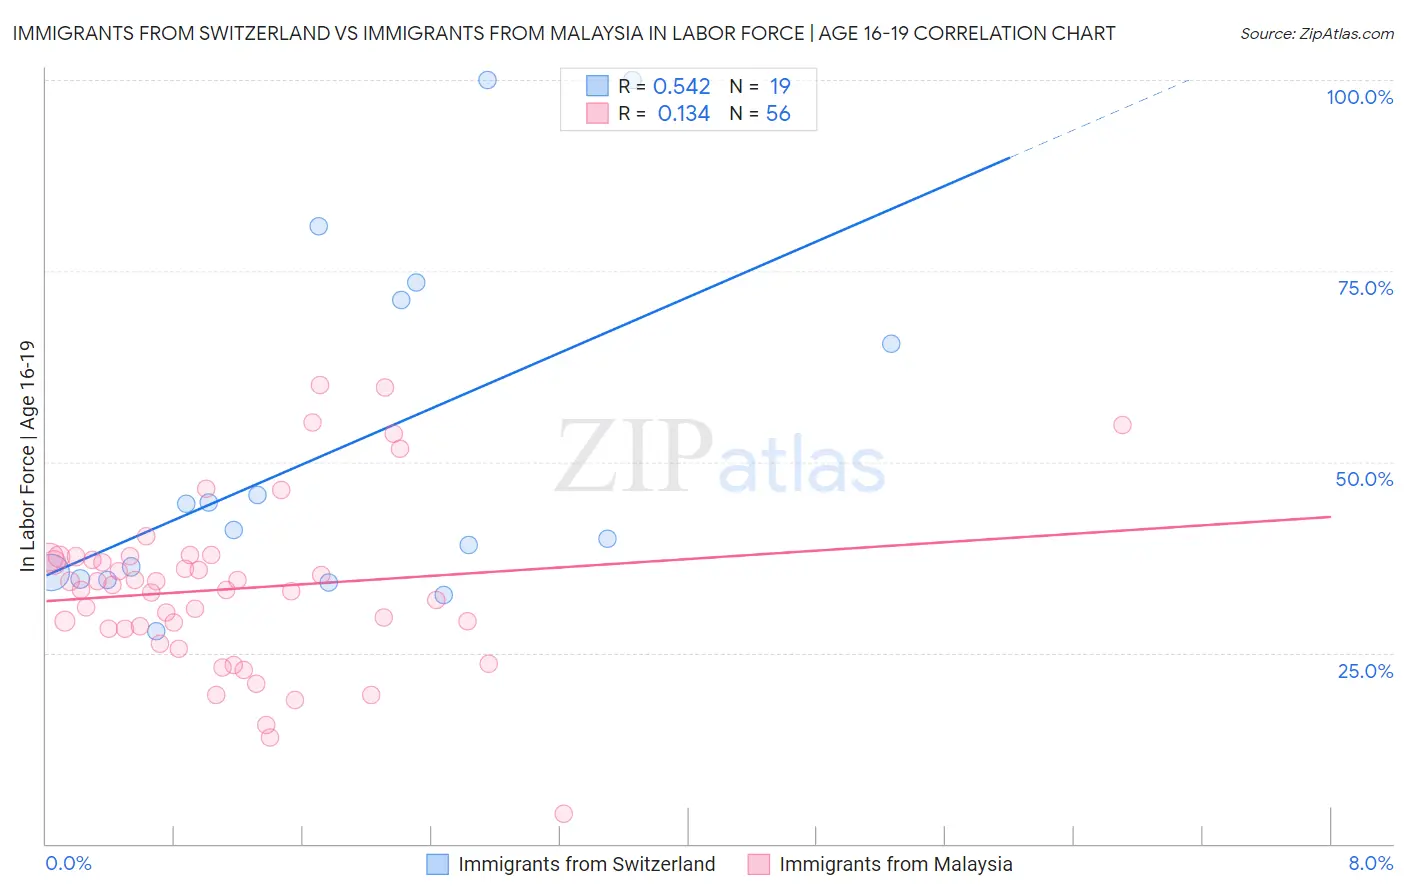
Immigrants from Switzerland vs Immigrants from Malaysia In Labor Force | Age 16-19 Correlation Chart
The statistical analysis conducted on geographies consisting of 147,934,864 people shows a substantial positive correlation between the proportion of Immigrants from Switzerland and labor force participation rate among population between the ages 16 and 19 in the United States with a correlation coefficient (R) of 0.542 and weighted average of 35.6%. Similarly, the statistical analysis conducted on geographies consisting of 197,895,635 people shows a poor positive correlation between the proportion of Immigrants from Malaysia and labor force participation rate among population between the ages 16 and 19 in the United States with a correlation coefficient (R) of 0.134 and weighted average of 34.3%, a difference of 4.0%.
In Labor Force | Age 16-19 Correlation Summary
| Measurement | Immigrants from Switzerland | Immigrants from Malaysia |
| Minimum | 27.7% | 4.0% |
| Maximum | 100.0% | 60.1% |
| Range | 72.3% | 56.1% |
| Mean | 51.7% | 33.4% |
| Median | 41.0% | 33.6% |
| Interquartile 25% (IQ1) | 34.7% | 28.1% |
| Interquartile 75% (IQ3) | 71.2% | 37.5% |
| Interquartile Range (IQR) | 36.5% | 9.4% |
| Standard Deviation (Sample) | 22.9% | 11.0% |
| Standard Deviation (Population) | 22.3% | 10.9% |
Similar Demographics by In Labor Force | Age 16-19
Demographics Similar to Immigrants from Switzerland by In Labor Force | Age 16-19
In terms of in labor force | age 16-19, the demographic groups most similar to Immigrants from Switzerland are Mexican (35.6%, a difference of 0.0%), Moroccan (35.7%, a difference of 0.10%), Houma (35.6%, a difference of 0.11%), Immigrants from Bolivia (35.6%, a difference of 0.11%), and Apache (35.6%, a difference of 0.12%).
| Demographics | Rating | Rank | In Labor Force | Age 16-19 |
| Immigrants | Nigeria | 16.8 /100 | #203 | Poor 35.8% |
| Immigrants | Albania | 15.0 /100 | #204 | Poor 35.8% |
| South American Indians | 14.6 /100 | #205 | Poor 35.8% |
| Chileans | 14.6 /100 | #206 | Poor 35.8% |
| Immigrants | Eastern Europe | 14.5 /100 | #207 | Poor 35.8% |
| Koreans | 13.3 /100 | #208 | Poor 35.7% |
| Moroccans | 12.7 /100 | #209 | Poor 35.7% |
| Immigrants | Switzerland | 11.9 /100 | #210 | Poor 35.6% |
| Mexicans | 11.9 /100 | #211 | Poor 35.6% |
| Houma | 11.0 /100 | #212 | Poor 35.6% |
| Immigrants | Bolivia | 11.0 /100 | #213 | Poor 35.6% |
| Apache | 11.0 /100 | #214 | Poor 35.6% |
| Immigrants | South Eastern Asia | 10.8 /100 | #215 | Poor 35.6% |
| Dutch West Indians | 10.7 /100 | #216 | Poor 35.6% |
| Immigrants | Costa Rica | 10.7 /100 | #217 | Poor 35.6% |
Demographics Similar to Immigrants from Malaysia by In Labor Force | Age 16-19
In terms of in labor force | age 16-19, the demographic groups most similar to Immigrants from Malaysia are Immigrants from El Salvador (34.3%, a difference of 0.090%), Immigrants from Uruguay (34.4%, a difference of 0.33%), Immigrants from Peru (34.2%, a difference of 0.36%), Immigrants from Asia (34.1%, a difference of 0.48%), and Pima (34.1%, a difference of 0.56%).
| Demographics | Rating | Rank | In Labor Force | Age 16-19 |
| Immigrants | Immigrants | 1.2 /100 | #259 | Tragic 34.6% |
| Egyptians | 1.2 /100 | #260 | Tragic 34.5% |
| Salvadorans | 1.1 /100 | #261 | Tragic 34.5% |
| Hispanics or Latinos | 1.1 /100 | #262 | Tragic 34.5% |
| Burmese | 1.1 /100 | #263 | Tragic 34.5% |
| Immigrants | Uruguay | 0.9 /100 | #264 | Tragic 34.4% |
| Immigrants | El Salvador | 0.7 /100 | #265 | Tragic 34.3% |
| Immigrants | Malaysia | 0.7 /100 | #266 | Tragic 34.3% |
| Immigrants | Peru | 0.5 /100 | #267 | Tragic 34.2% |
| Immigrants | Asia | 0.5 /100 | #268 | Tragic 34.1% |
| Pima | 0.5 /100 | #269 | Tragic 34.1% |
| Immigrants | Russia | 0.4 /100 | #270 | Tragic 34.1% |
| Central American Indians | 0.4 /100 | #271 | Tragic 34.1% |
| Asians | 0.4 /100 | #272 | Tragic 34.1% |
| Immigrants | Panama | 0.4 /100 | #273 | Tragic 34.0% |