Immigrants from Switzerland vs Sudanese In Labor Force | Age 16-19
COMPARE
Immigrants from Switzerland
Sudanese
In Labor Force | Age 16-19
In Labor Force | Age 16-19 Comparison
Immigrants from Switzerland
Sudanese
35.6%
IN LABOR FORCE | AGE 16-19
11.9/ 100
METRIC RATING
210th/ 347
METRIC RANK
42.9%
IN LABOR FORCE | AGE 16-19
100.0/ 100
METRIC RATING
22nd/ 347
METRIC RANK
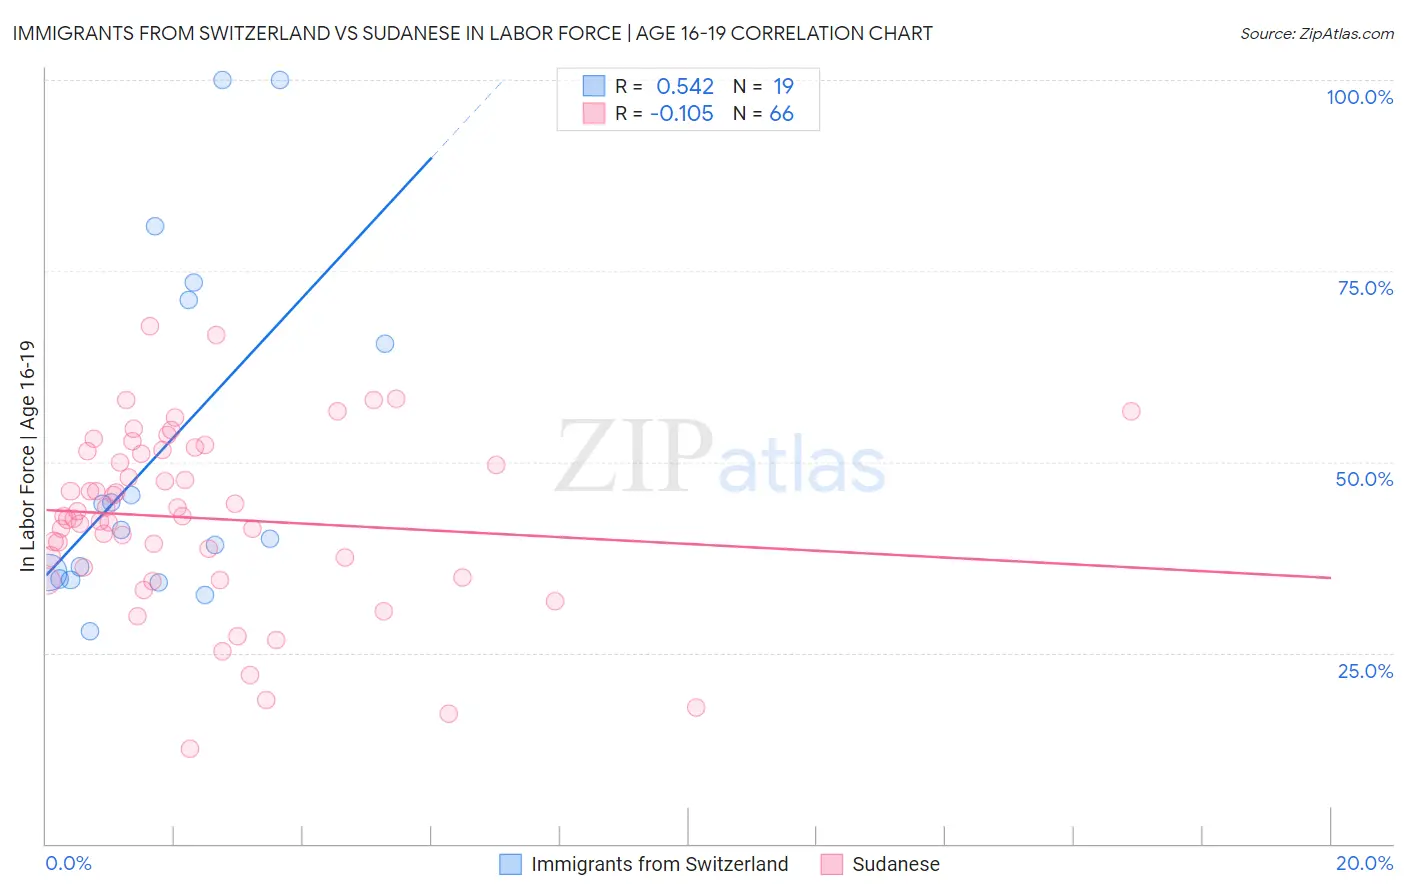
Immigrants from Switzerland vs Sudanese In Labor Force | Age 16-19 Correlation Chart
The statistical analysis conducted on geographies consisting of 147,934,864 people shows a substantial positive correlation between the proportion of Immigrants from Switzerland and labor force participation rate among population between the ages 16 and 19 in the United States with a correlation coefficient (R) of 0.542 and weighted average of 35.6%. Similarly, the statistical analysis conducted on geographies consisting of 110,142,178 people shows a poor negative correlation between the proportion of Sudanese and labor force participation rate among population between the ages 16 and 19 in the United States with a correlation coefficient (R) of -0.105 and weighted average of 42.9%, a difference of 20.2%.
In Labor Force | Age 16-19 Correlation Summary
| Measurement | Immigrants from Switzerland | Sudanese |
| Minimum | 27.7% | 12.5% |
| Maximum | 100.0% | 67.8% |
| Range | 72.3% | 55.3% |
| Mean | 51.7% | 42.6% |
| Median | 41.0% | 42.8% |
| Interquartile 25% (IQ1) | 34.7% | 36.1% |
| Interquartile 75% (IQ3) | 71.2% | 51.4% |
| Interquartile Range (IQR) | 36.5% | 15.3% |
| Standard Deviation (Sample) | 22.9% | 11.5% |
| Standard Deviation (Population) | 22.3% | 11.4% |
Similar Demographics by In Labor Force | Age 16-19
Demographics Similar to Immigrants from Switzerland by In Labor Force | Age 16-19
In terms of in labor force | age 16-19, the demographic groups most similar to Immigrants from Switzerland are Mexican (35.6%, a difference of 0.0%), Moroccan (35.7%, a difference of 0.10%), Houma (35.6%, a difference of 0.11%), Immigrants from Bolivia (35.6%, a difference of 0.11%), and Apache (35.6%, a difference of 0.12%).
| Demographics | Rating | Rank | In Labor Force | Age 16-19 |
| Immigrants | Nigeria | 16.8 /100 | #203 | Poor 35.8% |
| Immigrants | Albania | 15.0 /100 | #204 | Poor 35.8% |
| South American Indians | 14.6 /100 | #205 | Poor 35.8% |
| Chileans | 14.6 /100 | #206 | Poor 35.8% |
| Immigrants | Eastern Europe | 14.5 /100 | #207 | Poor 35.8% |
| Koreans | 13.3 /100 | #208 | Poor 35.7% |
| Moroccans | 12.7 /100 | #209 | Poor 35.7% |
| Immigrants | Switzerland | 11.9 /100 | #210 | Poor 35.6% |
| Mexicans | 11.9 /100 | #211 | Poor 35.6% |
| Houma | 11.0 /100 | #212 | Poor 35.6% |
| Immigrants | Bolivia | 11.0 /100 | #213 | Poor 35.6% |
| Apache | 11.0 /100 | #214 | Poor 35.6% |
| Immigrants | South Eastern Asia | 10.8 /100 | #215 | Poor 35.6% |
| Dutch West Indians | 10.7 /100 | #216 | Poor 35.6% |
| Immigrants | Costa Rica | 10.7 /100 | #217 | Poor 35.6% |
Demographics Similar to Sudanese by In Labor Force | Age 16-19
In terms of in labor force | age 16-19, the demographic groups most similar to Sudanese are Ottawa (43.0%, a difference of 0.40%), Slovak (42.6%, a difference of 0.59%), Bangladeshi (42.5%, a difference of 0.92%), Swiss (43.3%, a difference of 0.96%), and German Russian (42.4%, a difference of 1.0%).
| Demographics | Rating | Rank | In Labor Force | Age 16-19 |
| Slovenes | 100.0 /100 | #15 | Exceptional 43.7% |
| Czechs | 100.0 /100 | #16 | Exceptional 43.6% |
| Scandinavians | 100.0 /100 | #17 | Exceptional 43.6% |
| French Canadians | 100.0 /100 | #18 | Exceptional 43.6% |
| Belgians | 100.0 /100 | #19 | Exceptional 43.4% |
| Swiss | 100.0 /100 | #20 | Exceptional 43.3% |
| Ottawa | 100.0 /100 | #21 | Exceptional 43.0% |
| Sudanese | 100.0 /100 | #22 | Exceptional 42.9% |
| Slovaks | 100.0 /100 | #23 | Exceptional 42.6% |
| Bangladeshis | 100.0 /100 | #24 | Exceptional 42.5% |
| German Russians | 100.0 /100 | #25 | Exceptional 42.4% |
| English | 100.0 /100 | #26 | Exceptional 42.4% |
| Welsh | 100.0 /100 | #27 | Exceptional 42.3% |
| Poles | 100.0 /100 | #28 | Exceptional 42.1% |
| French | 100.0 /100 | #29 | Exceptional 42.1% |