Immigrants from Switzerland vs Immigrants from Europe In Labor Force | Age 16-19
COMPARE
Immigrants from Switzerland
Immigrants from Europe
In Labor Force | Age 16-19
In Labor Force | Age 16-19 Comparison
Immigrants from Switzerland
Immigrants from Europe
35.6%
IN LABOR FORCE | AGE 16-19
11.9/ 100
METRIC RATING
210th/ 347
METRIC RANK
36.2%
IN LABOR FORCE | AGE 16-19
31.8/ 100
METRIC RATING
188th/ 347
METRIC RANK
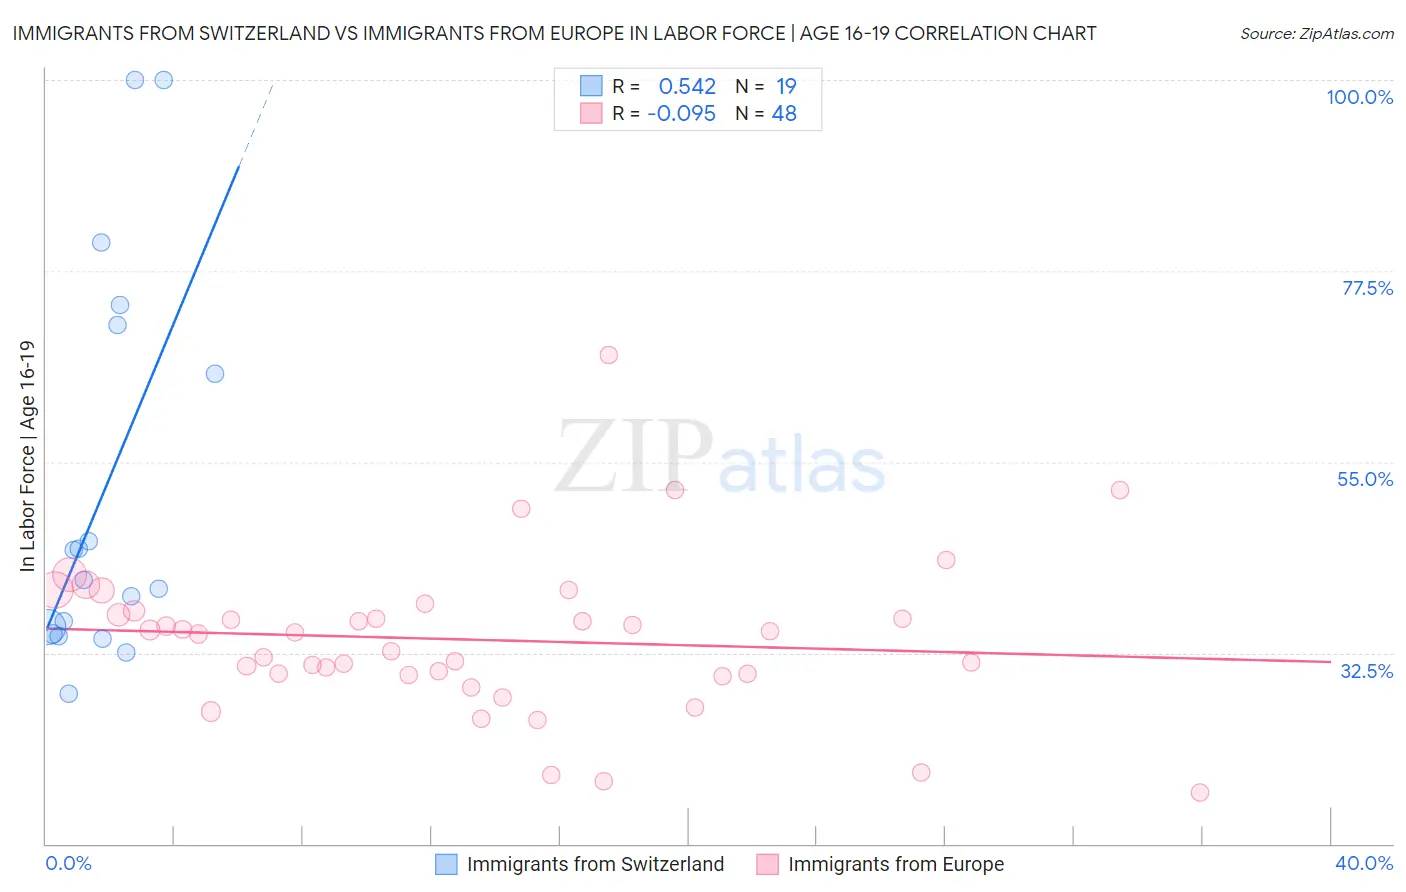
Immigrants from Switzerland vs Immigrants from Europe In Labor Force | Age 16-19 Correlation Chart
The statistical analysis conducted on geographies consisting of 147,934,864 people shows a substantial positive correlation between the proportion of Immigrants from Switzerland and labor force participation rate among population between the ages 16 and 19 in the United States with a correlation coefficient (R) of 0.542 and weighted average of 35.6%. Similarly, the statistical analysis conducted on geographies consisting of 544,647,771 people shows a slight negative correlation between the proportion of Immigrants from Europe and labor force participation rate among population between the ages 16 and 19 in the United States with a correlation coefficient (R) of -0.095 and weighted average of 36.2%, a difference of 1.6%.
In Labor Force | Age 16-19 Correlation Summary
| Measurement | Immigrants from Switzerland | Immigrants from Europe |
| Minimum | 27.7% | 16.1% |
| Maximum | 100.0% | 67.6% |
| Range | 72.3% | 51.5% |
| Mean | 51.7% | 34.1% |
| Median | 41.0% | 34.8% |
| Interquartile 25% (IQ1) | 34.7% | 29.9% |
| Interquartile 75% (IQ3) | 71.2% | 37.2% |
| Interquartile Range (IQR) | 36.5% | 7.3% |
| Standard Deviation (Sample) | 22.9% | 9.2% |
| Standard Deviation (Population) | 22.3% | 9.1% |
Similar Demographics by In Labor Force | Age 16-19
Demographics Similar to Immigrants from Switzerland by In Labor Force | Age 16-19
In terms of in labor force | age 16-19, the demographic groups most similar to Immigrants from Switzerland are Mexican (35.6%, a difference of 0.0%), Moroccan (35.7%, a difference of 0.10%), Houma (35.6%, a difference of 0.11%), Immigrants from Bolivia (35.6%, a difference of 0.11%), and Apache (35.6%, a difference of 0.12%).
| Demographics | Rating | Rank | In Labor Force | Age 16-19 |
| Immigrants | Nigeria | 16.8 /100 | #203 | Poor 35.8% |
| Immigrants | Albania | 15.0 /100 | #204 | Poor 35.8% |
| South American Indians | 14.6 /100 | #205 | Poor 35.8% |
| Chileans | 14.6 /100 | #206 | Poor 35.8% |
| Immigrants | Eastern Europe | 14.5 /100 | #207 | Poor 35.8% |
| Koreans | 13.3 /100 | #208 | Poor 35.7% |
| Moroccans | 12.7 /100 | #209 | Poor 35.7% |
| Immigrants | Switzerland | 11.9 /100 | #210 | Poor 35.6% |
| Mexicans | 11.9 /100 | #211 | Poor 35.6% |
| Houma | 11.0 /100 | #212 | Poor 35.6% |
| Immigrants | Bolivia | 11.0 /100 | #213 | Poor 35.6% |
| Apache | 11.0 /100 | #214 | Poor 35.6% |
| Immigrants | South Eastern Asia | 10.8 /100 | #215 | Poor 35.6% |
| Dutch West Indians | 10.7 /100 | #216 | Poor 35.6% |
| Immigrants | Costa Rica | 10.7 /100 | #217 | Poor 35.6% |
Demographics Similar to Immigrants from Europe by In Labor Force | Age 16-19
In terms of in labor force | age 16-19, the demographic groups most similar to Immigrants from Europe are Immigrants from Romania (36.3%, a difference of 0.13%), Immigrants from Afghanistan (36.3%, a difference of 0.13%), Immigrants from Hungary (36.2%, a difference of 0.18%), Panamanian (36.1%, a difference of 0.19%), and Bhutanese (36.3%, a difference of 0.20%).
| Demographics | Rating | Rank | In Labor Force | Age 16-19 |
| Jordanians | 39.6 /100 | #181 | Fair 36.4% |
| Immigrants | Italy | 39.1 /100 | #182 | Fair 36.4% |
| Eastern Europeans | 38.8 /100 | #183 | Fair 36.4% |
| Costa Ricans | 36.1 /100 | #184 | Fair 36.3% |
| Bhutanese | 35.3 /100 | #185 | Fair 36.3% |
| Immigrants | Romania | 34.0 /100 | #186 | Fair 36.3% |
| Immigrants | Afghanistan | 34.0 /100 | #187 | Fair 36.3% |
| Immigrants | Europe | 31.8 /100 | #188 | Fair 36.2% |
| Immigrants | Hungary | 28.8 /100 | #189 | Fair 36.2% |
| Panamanians | 28.6 /100 | #190 | Fair 36.1% |
| Immigrants | Croatia | 27.5 /100 | #191 | Fair 36.1% |
| Afghans | 25.7 /100 | #192 | Fair 36.1% |
| Immigrants | Denmark | 25.0 /100 | #193 | Fair 36.1% |
| Nigerians | 24.6 /100 | #194 | Fair 36.1% |
| Bolivians | 23.3 /100 | #195 | Fair 36.0% |