Immigrants from Canada vs Basque In Labor Force | Age 16-19
COMPARE
Immigrants from Canada
Basque
In Labor Force | Age 16-19
In Labor Force | Age 16-19 Comparison
Immigrants from Canada
Basques
38.9%
IN LABOR FORCE | AGE 16-19
99.4/ 100
METRIC RATING
94th/ 347
METRIC RANK
39.3%
IN LABOR FORCE | AGE 16-19
99.7/ 100
METRIC RATING
82nd/ 347
METRIC RANK
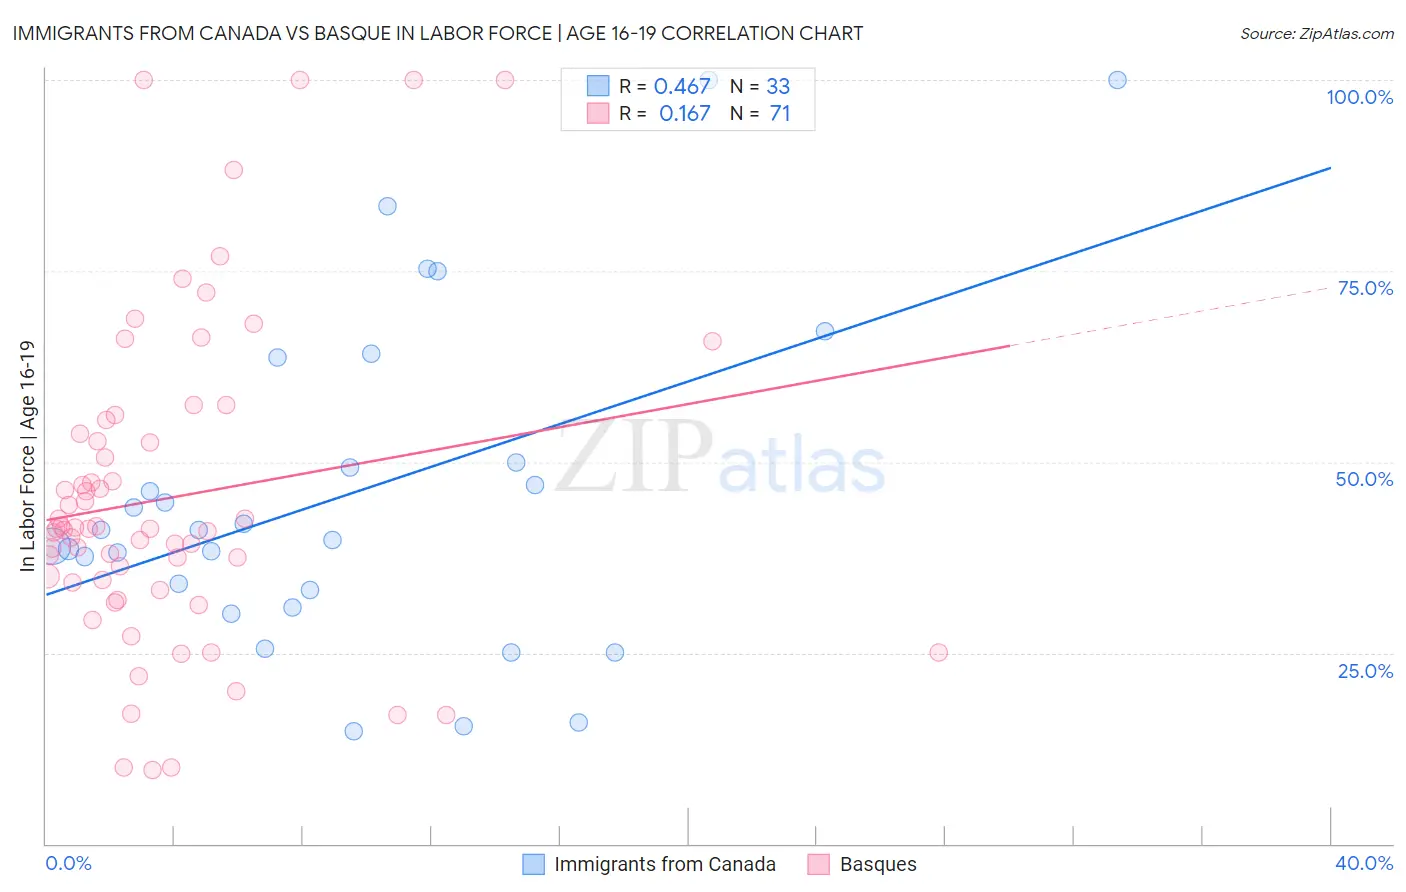
Immigrants from Canada vs Basque In Labor Force | Age 16-19 Correlation Chart
The statistical analysis conducted on geographies consisting of 458,098,188 people shows a moderate positive correlation between the proportion of Immigrants from Canada and labor force participation rate among population between the ages 16 and 19 in the United States with a correlation coefficient (R) of 0.467 and weighted average of 38.9%. Similarly, the statistical analysis conducted on geographies consisting of 165,637,018 people shows a poor positive correlation between the proportion of Basques and labor force participation rate among population between the ages 16 and 19 in the United States with a correlation coefficient (R) of 0.167 and weighted average of 39.3%, a difference of 0.86%.
In Labor Force | Age 16-19 Correlation Summary
| Measurement | Immigrants from Canada | Basque |
| Minimum | 14.7% | 9.7% |
| Maximum | 100.0% | 100.0% |
| Range | 85.3% | 90.3% |
| Mean | 45.9% | 45.3% |
| Median | 41.0% | 41.3% |
| Interquartile 25% (IQ1) | 32.1% | 34.2% |
| Interquartile 75% (IQ3) | 56.8% | 53.7% |
| Interquartile Range (IQR) | 24.7% | 19.5% |
| Standard Deviation (Sample) | 21.9% | 20.8% |
| Standard Deviation (Population) | 21.6% | 20.7% |
Demographics Similar to Immigrants from Canada and Basques by In Labor Force | Age 16-19
In terms of in labor force | age 16-19, the demographic groups most similar to Immigrants from Canada are Blackfeet (38.9%, a difference of 0.010%), Osage (39.0%, a difference of 0.060%), Immigrants from North America (38.9%, a difference of 0.090%), Latvian (38.9%, a difference of 0.12%), and Spanish American (39.0%, a difference of 0.15%). Similarly, the demographic groups most similar to Basques are Spanish (39.3%, a difference of 0.020%), Shoshone (39.3%, a difference of 0.060%), Immigrants from Uganda (39.2%, a difference of 0.15%), Creek (39.1%, a difference of 0.30%), and Samoan (39.1%, a difference of 0.32%).
| Demographics | Rating | Rank | In Labor Force | Age 16-19 |
| Austrians | 99.8 /100 | #78 | Exceptional 39.5% |
| Marshallese | 99.8 /100 | #79 | Exceptional 39.5% |
| Immigrants | Iraq | 99.8 /100 | #80 | Exceptional 39.4% |
| Shoshone | 99.7 /100 | #81 | Exceptional 39.3% |
| Basques | 99.7 /100 | #82 | Exceptional 39.3% |
| Spanish | 99.7 /100 | #83 | Exceptional 39.3% |
| Immigrants | Uganda | 99.7 /100 | #84 | Exceptional 39.2% |
| Creek | 99.6 /100 | #85 | Exceptional 39.1% |
| Samoans | 99.6 /100 | #86 | Exceptional 39.1% |
| Immigrants | Germany | 99.6 /100 | #87 | Exceptional 39.1% |
| Puget Sound Salish | 99.6 /100 | #88 | Exceptional 39.1% |
| Alaska Natives | 99.6 /100 | #89 | Exceptional 39.1% |
| Immigrants | Burma/Myanmar | 99.5 /100 | #90 | Exceptional 39.0% |
| Spanish Americans | 99.5 /100 | #91 | Exceptional 39.0% |
| Osage | 99.4 /100 | #92 | Exceptional 39.0% |
| Blackfeet | 99.4 /100 | #93 | Exceptional 38.9% |
| Immigrants | Canada | 99.4 /100 | #94 | Exceptional 38.9% |
| Immigrants | North America | 99.4 /100 | #95 | Exceptional 38.9% |
| Latvians | 99.4 /100 | #96 | Exceptional 38.9% |
| Greeks | 99.3 /100 | #97 | Exceptional 38.9% |
| Ugandans | 99.3 /100 | #98 | Exceptional 38.9% |