Iroquois vs Basque In Labor Force | Age 16-19
COMPARE
Iroquois
Basque
In Labor Force | Age 16-19
In Labor Force | Age 16-19 Comparison
Iroquois
Basques
39.9%
IN LABOR FORCE | AGE 16-19
99.9/ 100
METRIC RATING
72nd/ 347
METRIC RANK
39.3%
IN LABOR FORCE | AGE 16-19
99.7/ 100
METRIC RATING
82nd/ 347
METRIC RANK
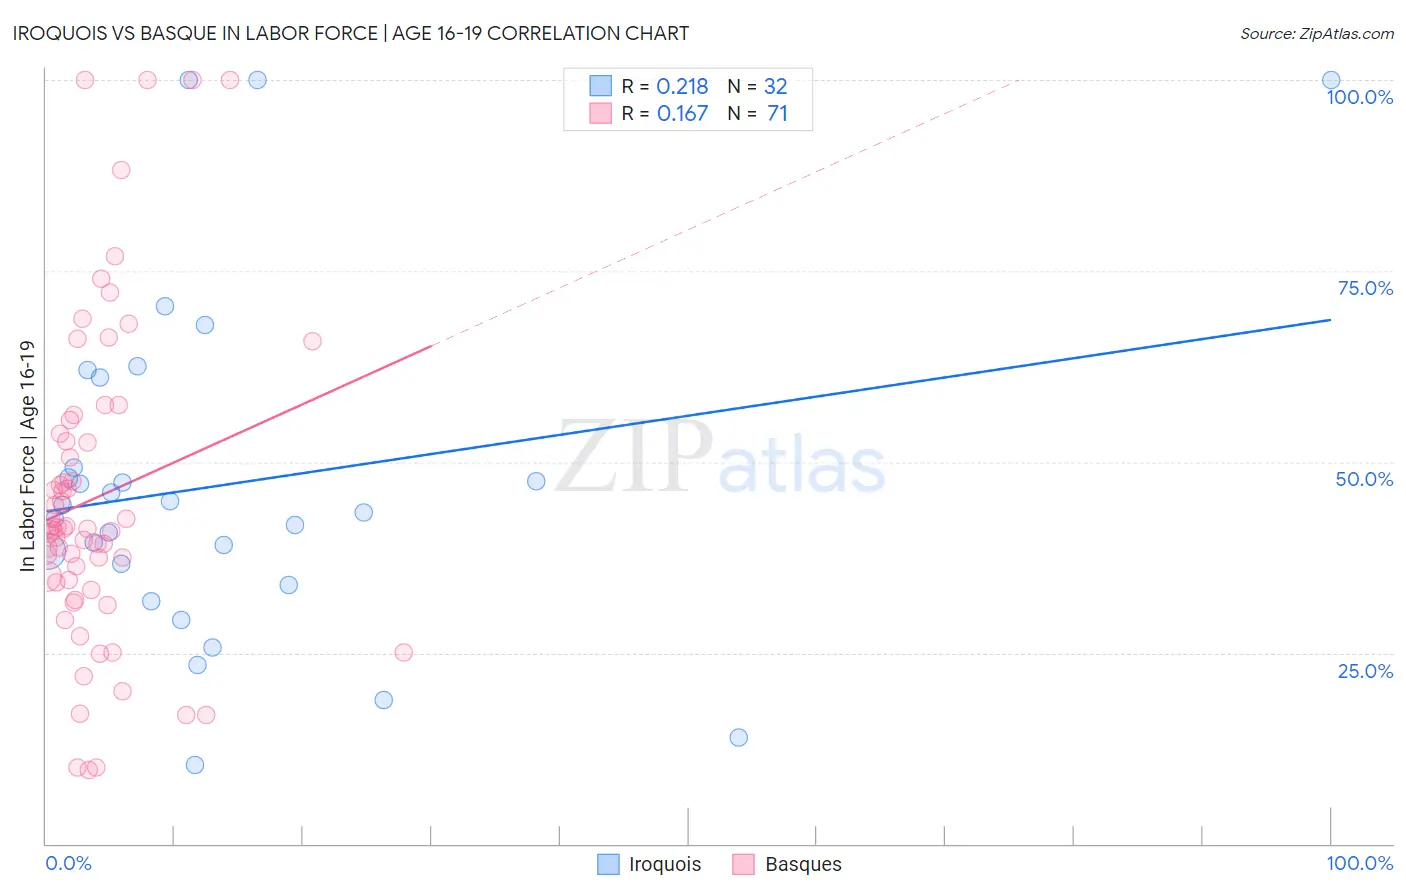
Iroquois vs Basque In Labor Force | Age 16-19 Correlation Chart
The statistical analysis conducted on geographies consisting of 207,097,008 people shows a weak positive correlation between the proportion of Iroquois and labor force participation rate among population between the ages 16 and 19 in the United States with a correlation coefficient (R) of 0.218 and weighted average of 39.9%. Similarly, the statistical analysis conducted on geographies consisting of 165,637,018 people shows a poor positive correlation between the proportion of Basques and labor force participation rate among population between the ages 16 and 19 in the United States with a correlation coefficient (R) of 0.167 and weighted average of 39.3%, a difference of 1.7%.
In Labor Force | Age 16-19 Correlation Summary
| Measurement | Iroquois | Basque |
| Minimum | 10.4% | 9.7% |
| Maximum | 100.0% | 100.0% |
| Range | 89.6% | 90.3% |
| Mean | 47.1% | 45.3% |
| Median | 43.8% | 41.3% |
| Interquartile 25% (IQ1) | 35.2% | 34.2% |
| Interquartile 75% (IQ3) | 55.2% | 53.7% |
| Interquartile Range (IQR) | 19.9% | 19.5% |
| Standard Deviation (Sample) | 22.3% | 20.8% |
| Standard Deviation (Population) | 22.0% | 20.7% |
Demographics Similar to Iroquois and Basques by In Labor Force | Age 16-19
In terms of in labor force | age 16-19, the demographic groups most similar to Iroquois are Serbian (39.9%, a difference of 0.010%), Immigrants from Middle Africa (39.9%, a difference of 0.030%), Portuguese (40.0%, a difference of 0.17%), Potawatomi (40.0%, a difference of 0.22%), and Hungarian (39.8%, a difference of 0.26%). Similarly, the demographic groups most similar to Basques are Spanish (39.3%, a difference of 0.020%), Shoshone (39.3%, a difference of 0.060%), Immigrants from Uganda (39.2%, a difference of 0.15%), Creek (39.1%, a difference of 0.30%), and Samoan (39.1%, a difference of 0.32%).
| Demographics | Rating | Rank | In Labor Force | Age 16-19 |
| Canadians | 100.0 /100 | #67 | Exceptional 40.1% |
| Italians | 99.9 /100 | #68 | Exceptional 40.1% |
| Potawatomi | 99.9 /100 | #69 | Exceptional 40.0% |
| Portuguese | 99.9 /100 | #70 | Exceptional 40.0% |
| Serbians | 99.9 /100 | #71 | Exceptional 39.9% |
| Iroquois | 99.9 /100 | #72 | Exceptional 39.9% |
| Immigrants | Middle Africa | 99.9 /100 | #73 | Exceptional 39.9% |
| Hungarians | 99.9 /100 | #74 | Exceptional 39.8% |
| French American Indians | 99.9 /100 | #75 | Exceptional 39.8% |
| Malaysians | 99.9 /100 | #76 | Exceptional 39.7% |
| Immigrants | Portugal | 99.9 /100 | #77 | Exceptional 39.7% |
| Austrians | 99.8 /100 | #78 | Exceptional 39.5% |
| Marshallese | 99.8 /100 | #79 | Exceptional 39.5% |
| Immigrants | Iraq | 99.8 /100 | #80 | Exceptional 39.4% |
| Shoshone | 99.7 /100 | #81 | Exceptional 39.3% |
| Basques | 99.7 /100 | #82 | Exceptional 39.3% |
| Spanish | 99.7 /100 | #83 | Exceptional 39.3% |
| Immigrants | Uganda | 99.7 /100 | #84 | Exceptional 39.2% |
| Creek | 99.6 /100 | #85 | Exceptional 39.1% |
| Samoans | 99.6 /100 | #86 | Exceptional 39.1% |
| Immigrants | Germany | 99.6 /100 | #87 | Exceptional 39.1% |