Immigrants from Switzerland vs Inupiat In Labor Force | Age 16-19
COMPARE
Immigrants from Switzerland
Inupiat
In Labor Force | Age 16-19
In Labor Force | Age 16-19 Comparison
Immigrants from Switzerland
Inupiat
35.6%
IN LABOR FORCE | AGE 16-19
11.9/ 100
METRIC RATING
210th/ 347
METRIC RANK
35.0%
IN LABOR FORCE | AGE 16-19
3.2/ 100
METRIC RATING
239th/ 347
METRIC RANK
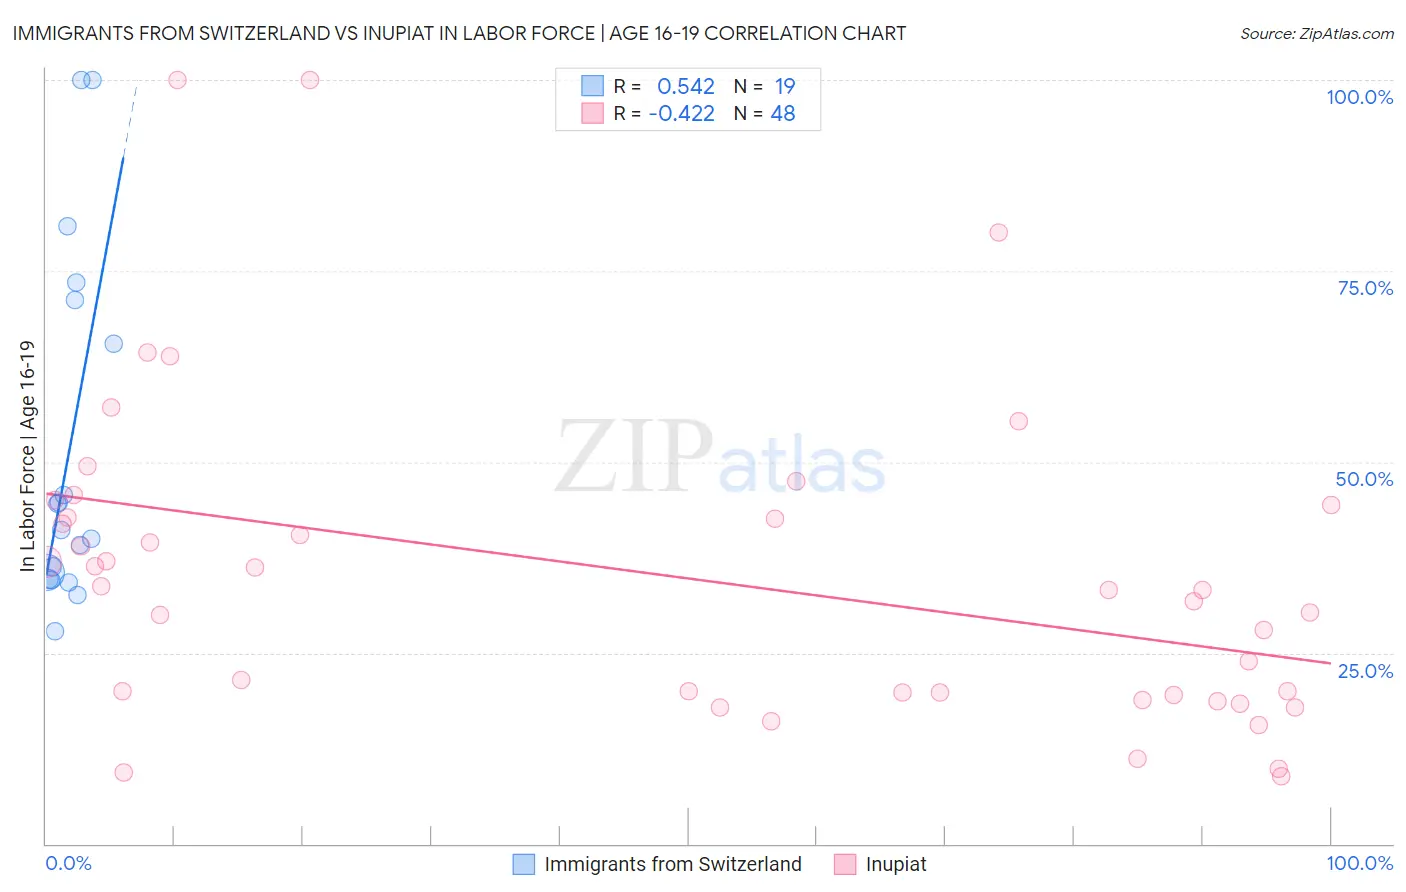
Immigrants from Switzerland vs Inupiat In Labor Force | Age 16-19 Correlation Chart
The statistical analysis conducted on geographies consisting of 147,934,864 people shows a substantial positive correlation between the proportion of Immigrants from Switzerland and labor force participation rate among population between the ages 16 and 19 in the United States with a correlation coefficient (R) of 0.542 and weighted average of 35.6%. Similarly, the statistical analysis conducted on geographies consisting of 96,280,453 people shows a moderate negative correlation between the proportion of Inupiat and labor force participation rate among population between the ages 16 and 19 in the United States with a correlation coefficient (R) of -0.422 and weighted average of 35.0%, a difference of 1.9%.
In Labor Force | Age 16-19 Correlation Summary
| Measurement | Immigrants from Switzerland | Inupiat |
| Minimum | 27.7% | 8.8% |
| Maximum | 100.0% | 100.0% |
| Range | 72.3% | 91.2% |
| Mean | 51.7% | 35.2% |
| Median | 41.0% | 33.3% |
| Interquartile 25% (IQ1) | 34.7% | 19.6% |
| Interquartile 75% (IQ3) | 71.2% | 43.6% |
| Interquartile Range (IQR) | 36.5% | 24.0% |
| Standard Deviation (Sample) | 22.9% | 20.9% |
| Standard Deviation (Population) | 22.3% | 20.6% |
Similar Demographics by In Labor Force | Age 16-19
Demographics Similar to Immigrants from Switzerland by In Labor Force | Age 16-19
In terms of in labor force | age 16-19, the demographic groups most similar to Immigrants from Switzerland are Mexican (35.6%, a difference of 0.0%), Moroccan (35.7%, a difference of 0.10%), Houma (35.6%, a difference of 0.11%), Immigrants from Bolivia (35.6%, a difference of 0.11%), and Apache (35.6%, a difference of 0.12%).
| Demographics | Rating | Rank | In Labor Force | Age 16-19 |
| Immigrants | Nigeria | 16.8 /100 | #203 | Poor 35.8% |
| Immigrants | Albania | 15.0 /100 | #204 | Poor 35.8% |
| South American Indians | 14.6 /100 | #205 | Poor 35.8% |
| Chileans | 14.6 /100 | #206 | Poor 35.8% |
| Immigrants | Eastern Europe | 14.5 /100 | #207 | Poor 35.8% |
| Koreans | 13.3 /100 | #208 | Poor 35.7% |
| Moroccans | 12.7 /100 | #209 | Poor 35.7% |
| Immigrants | Switzerland | 11.9 /100 | #210 | Poor 35.6% |
| Mexicans | 11.9 /100 | #211 | Poor 35.6% |
| Houma | 11.0 /100 | #212 | Poor 35.6% |
| Immigrants | Bolivia | 11.0 /100 | #213 | Poor 35.6% |
| Apache | 11.0 /100 | #214 | Poor 35.6% |
| Immigrants | South Eastern Asia | 10.8 /100 | #215 | Poor 35.6% |
| Dutch West Indians | 10.7 /100 | #216 | Poor 35.6% |
| Immigrants | Costa Rica | 10.7 /100 | #217 | Poor 35.6% |
Demographics Similar to Inupiat by In Labor Force | Age 16-19
In terms of in labor force | age 16-19, the demographic groups most similar to Inupiat are Immigrants from Vietnam (35.0%, a difference of 0.090%), Immigrants from Central America (35.0%, a difference of 0.10%), Immigrants from Ireland (35.0%, a difference of 0.13%), Immigrants from India (35.0%, a difference of 0.14%), and Immigrants from Australia (35.1%, a difference of 0.16%).
| Demographics | Rating | Rank | In Labor Force | Age 16-19 |
| Immigrants | Kazakhstan | 4.5 /100 | #232 | Tragic 35.2% |
| Immigrants | France | 4.3 /100 | #233 | Tragic 35.1% |
| Immigrants | Mexico | 4.2 /100 | #234 | Tragic 35.1% |
| Immigrants | Philippines | 4.0 /100 | #235 | Tragic 35.1% |
| Immigrants | Australia | 3.6 /100 | #236 | Tragic 35.1% |
| Immigrants | India | 3.5 /100 | #237 | Tragic 35.0% |
| Immigrants | Vietnam | 3.4 /100 | #238 | Tragic 35.0% |
| Inupiat | 3.2 /100 | #239 | Tragic 35.0% |
| Immigrants | Central America | 3.0 /100 | #240 | Tragic 35.0% |
| Immigrants | Ireland | 2.9 /100 | #241 | Tragic 35.0% |
| Uruguayans | 2.6 /100 | #242 | Tragic 34.9% |
| Pueblo | 2.6 /100 | #243 | Tragic 34.9% |
| Immigrants | Turkey | 2.6 /100 | #244 | Tragic 34.9% |
| Immigrants | Greece | 2.4 /100 | #245 | Tragic 34.9% |
| Immigrants | Sri Lanka | 2.4 /100 | #246 | Tragic 34.9% |