Immigrants from Scotland vs Spanish American In Labor Force | Age 16-19
COMPARE
Immigrants from Scotland
Spanish American
In Labor Force | Age 16-19
In Labor Force | Age 16-19 Comparison
Immigrants from Scotland
Spanish Americans
38.5%
IN LABOR FORCE | AGE 16-19
98.5/ 100
METRIC RATING
112th/ 347
METRIC RANK
39.0%
IN LABOR FORCE | AGE 16-19
99.5/ 100
METRIC RATING
91st/ 347
METRIC RANK
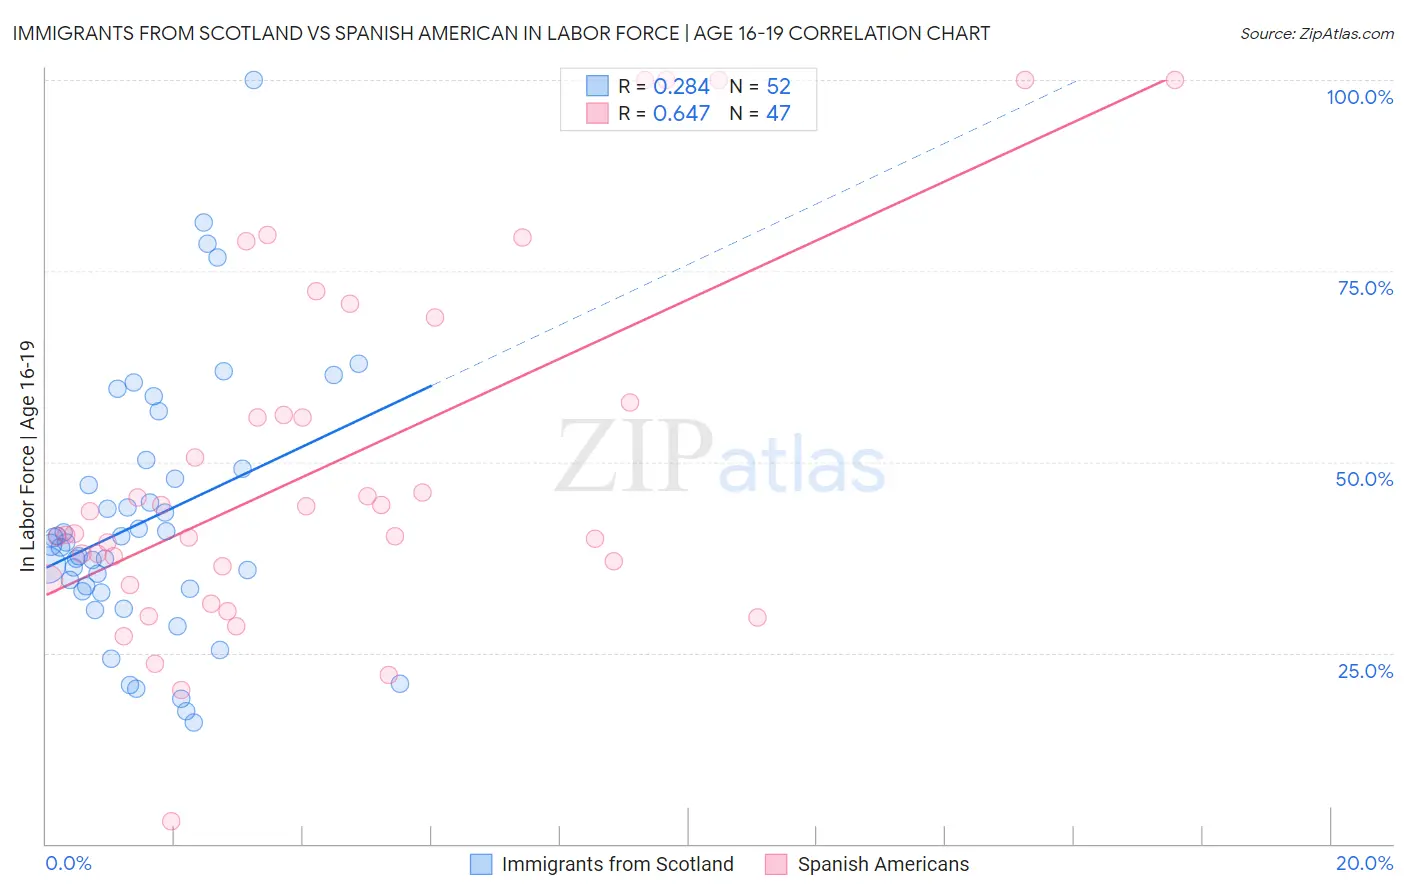
Immigrants from Scotland vs Spanish American In Labor Force | Age 16-19 Correlation Chart
The statistical analysis conducted on geographies consisting of 196,210,607 people shows a weak positive correlation between the proportion of Immigrants from Scotland and labor force participation rate among population between the ages 16 and 19 in the United States with a correlation coefficient (R) of 0.284 and weighted average of 38.5%. Similarly, the statistical analysis conducted on geographies consisting of 103,105,660 people shows a significant positive correlation between the proportion of Spanish Americans and labor force participation rate among population between the ages 16 and 19 in the United States with a correlation coefficient (R) of 0.647 and weighted average of 39.0%, a difference of 1.3%.
In Labor Force | Age 16-19 Correlation Summary
| Measurement | Immigrants from Scotland | Spanish American |
| Minimum | 15.9% | 3.0% |
| Maximum | 100.0% | 100.0% |
| Range | 84.1% | 97.0% |
| Mean | 42.4% | 49.4% |
| Median | 39.3% | 40.5% |
| Interquartile 25% (IQ1) | 33.2% | 34.6% |
| Interquartile 75% (IQ3) | 48.5% | 57.8% |
| Interquartile Range (IQR) | 15.3% | 23.2% |
| Standard Deviation (Sample) | 17.1% | 23.7% |
| Standard Deviation (Population) | 16.9% | 23.4% |
Similar Demographics by In Labor Force | Age 16-19
Demographics Similar to Immigrants from Scotland by In Labor Force | Age 16-19
In terms of in labor force | age 16-19, the demographic groups most similar to Immigrants from Scotland are Crow (38.5%, a difference of 0.010%), Maltese (38.5%, a difference of 0.070%), Subsaharan African (38.4%, a difference of 0.13%), Lebanese (38.6%, a difference of 0.19%), and Immigrants from Ethiopia (38.6%, a difference of 0.20%).
| Demographics | Rating | Rank | In Labor Force | Age 16-19 |
| Iraqis | 98.9 /100 | #105 | Exceptional 38.6% |
| Delaware | 98.8 /100 | #106 | Exceptional 38.6% |
| Chinese | 98.8 /100 | #107 | Exceptional 38.6% |
| Immigrants | Ethiopia | 98.7 /100 | #108 | Exceptional 38.6% |
| Lebanese | 98.7 /100 | #109 | Exceptional 38.6% |
| Maltese | 98.6 /100 | #110 | Exceptional 38.5% |
| Crow | 98.5 /100 | #111 | Exceptional 38.5% |
| Immigrants | Scotland | 98.5 /100 | #112 | Exceptional 38.5% |
| Sub-Saharan Africans | 98.3 /100 | #113 | Exceptional 38.4% |
| Hawaiians | 98.2 /100 | #114 | Exceptional 38.4% |
| Bulgarians | 97.9 /100 | #115 | Exceptional 38.3% |
| Colville | 97.9 /100 | #116 | Exceptional 38.3% |
| Chickasaw | 97.8 /100 | #117 | Exceptional 38.3% |
| Immigrants | Nepal | 97.8 /100 | #118 | Exceptional 38.3% |
| Assyrians/Chaldeans/Syriacs | 97.8 /100 | #119 | Exceptional 38.3% |
Demographics Similar to Spanish Americans by In Labor Force | Age 16-19
In terms of in labor force | age 16-19, the demographic groups most similar to Spanish Americans are Osage (39.0%, a difference of 0.090%), Immigrants from Burma/Myanmar (39.0%, a difference of 0.15%), Blackfeet (38.9%, a difference of 0.15%), Immigrants from Canada (38.9%, a difference of 0.15%), and Alaska Native (39.1%, a difference of 0.22%).
| Demographics | Rating | Rank | In Labor Force | Age 16-19 |
| Immigrants | Uganda | 99.7 /100 | #84 | Exceptional 39.2% |
| Creek | 99.6 /100 | #85 | Exceptional 39.1% |
| Samoans | 99.6 /100 | #86 | Exceptional 39.1% |
| Immigrants | Germany | 99.6 /100 | #87 | Exceptional 39.1% |
| Puget Sound Salish | 99.6 /100 | #88 | Exceptional 39.1% |
| Alaska Natives | 99.6 /100 | #89 | Exceptional 39.1% |
| Immigrants | Burma/Myanmar | 99.5 /100 | #90 | Exceptional 39.0% |
| Spanish Americans | 99.5 /100 | #91 | Exceptional 39.0% |
| Osage | 99.4 /100 | #92 | Exceptional 39.0% |
| Blackfeet | 99.4 /100 | #93 | Exceptional 38.9% |
| Immigrants | Canada | 99.4 /100 | #94 | Exceptional 38.9% |
| Immigrants | North America | 99.4 /100 | #95 | Exceptional 38.9% |
| Latvians | 99.4 /100 | #96 | Exceptional 38.9% |
| Greeks | 99.3 /100 | #97 | Exceptional 38.9% |
| Ugandans | 99.3 /100 | #98 | Exceptional 38.9% |