Immigrants from Dominica vs Spanish American In Labor Force | Age 16-19
COMPARE
Immigrants from Dominica
Spanish American
In Labor Force | Age 16-19
In Labor Force | Age 16-19 Comparison
Immigrants from Dominica
Spanish Americans
32.5%
IN LABOR FORCE | AGE 16-19
0.0/ 100
METRIC RATING
303rd/ 347
METRIC RANK
39.0%
IN LABOR FORCE | AGE 16-19
99.5/ 100
METRIC RATING
91st/ 347
METRIC RANK
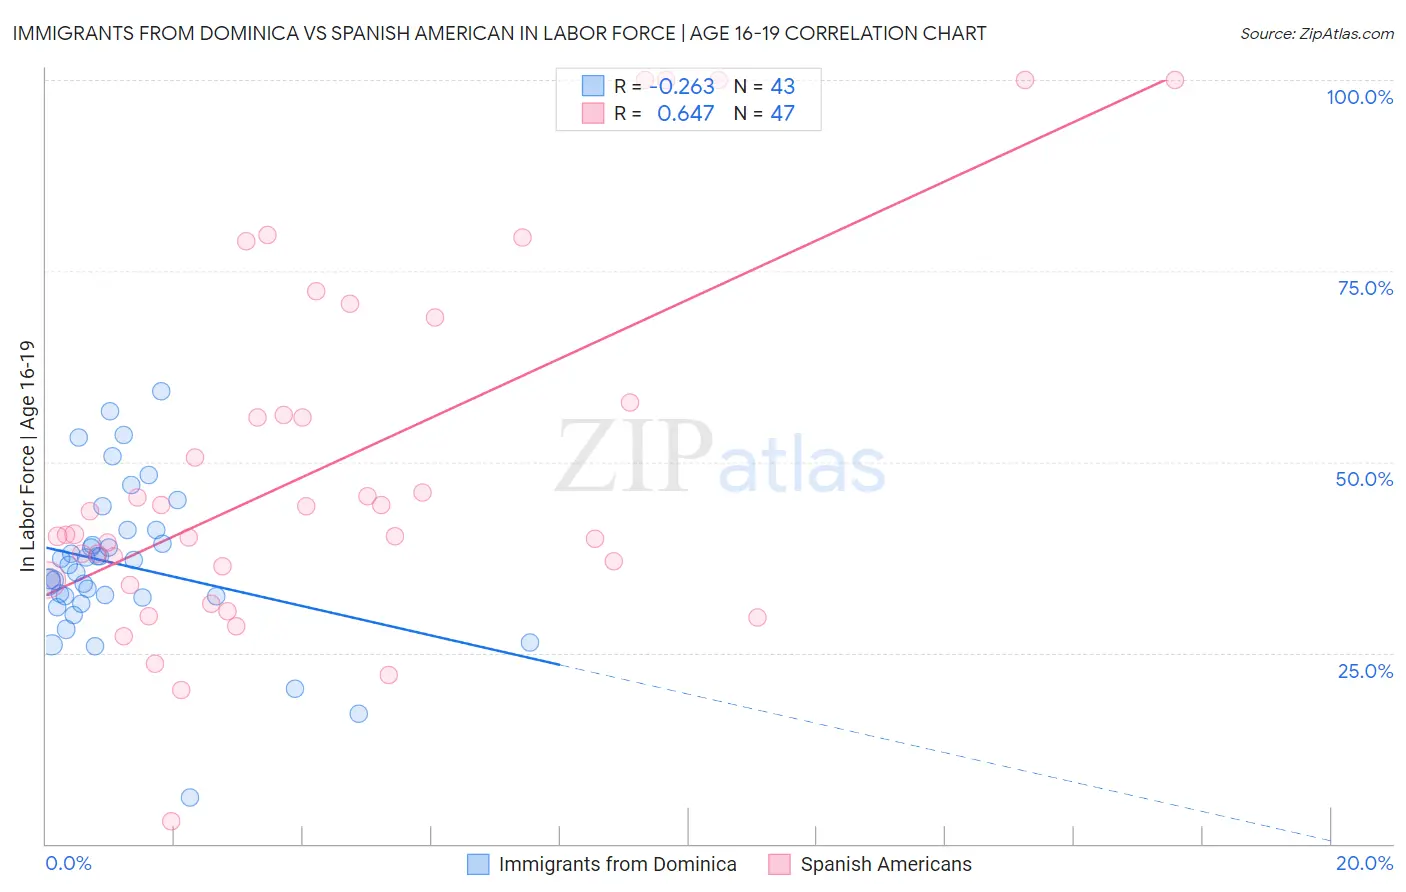
Immigrants from Dominica vs Spanish American In Labor Force | Age 16-19 Correlation Chart
The statistical analysis conducted on geographies consisting of 83,778,469 people shows a weak negative correlation between the proportion of Immigrants from Dominica and labor force participation rate among population between the ages 16 and 19 in the United States with a correlation coefficient (R) of -0.263 and weighted average of 32.5%. Similarly, the statistical analysis conducted on geographies consisting of 103,105,660 people shows a significant positive correlation between the proportion of Spanish Americans and labor force participation rate among population between the ages 16 and 19 in the United States with a correlation coefficient (R) of 0.647 and weighted average of 39.0%, a difference of 20.1%.
In Labor Force | Age 16-19 Correlation Summary
| Measurement | Immigrants from Dominica | Spanish American |
| Minimum | 6.0% | 3.0% |
| Maximum | 59.2% | 100.0% |
| Range | 53.2% | 97.0% |
| Mean | 36.5% | 49.4% |
| Median | 36.5% | 40.5% |
| Interquartile 25% (IQ1) | 32.3% | 34.6% |
| Interquartile 75% (IQ3) | 41.0% | 57.8% |
| Interquartile Range (IQR) | 8.7% | 23.2% |
| Standard Deviation (Sample) | 10.1% | 23.7% |
| Standard Deviation (Population) | 10.0% | 23.4% |
Similar Demographics by In Labor Force | Age 16-19
Demographics Similar to Immigrants from Dominica by In Labor Force | Age 16-19
In terms of in labor force | age 16-19, the demographic groups most similar to Immigrants from Dominica are Israeli (32.4%, a difference of 0.19%), Nicaraguan (32.4%, a difference of 0.24%), Spanish American Indian (32.4%, a difference of 0.37%), Immigrants from Jamaica (32.2%, a difference of 0.86%), and Belizean (32.8%, a difference of 0.90%).
| Demographics | Rating | Rank | In Labor Force | Age 16-19 |
| Jamaicans | 0.1 /100 | #296 | Tragic 33.2% |
| Immigrants | Haiti | 0.1 /100 | #297 | Tragic 33.2% |
| Iranians | 0.0 /100 | #298 | Tragic 33.0% |
| Armenians | 0.0 /100 | #299 | Tragic 32.9% |
| Immigrants | Argentina | 0.0 /100 | #300 | Tragic 32.9% |
| Okinawans | 0.0 /100 | #301 | Tragic 32.8% |
| Belizeans | 0.0 /100 | #302 | Tragic 32.8% |
| Immigrants | Dominica | 0.0 /100 | #303 | Tragic 32.5% |
| Israelis | 0.0 /100 | #304 | Tragic 32.4% |
| Nicaraguans | 0.0 /100 | #305 | Tragic 32.4% |
| Spanish American Indians | 0.0 /100 | #306 | Tragic 32.4% |
| Immigrants | Jamaica | 0.0 /100 | #307 | Tragic 32.2% |
| Navajo | 0.0 /100 | #308 | Tragic 32.1% |
| Immigrants | Eastern Asia | 0.0 /100 | #309 | Tragic 32.0% |
| Immigrants | Iran | 0.0 /100 | #310 | Tragic 32.0% |
Demographics Similar to Spanish Americans by In Labor Force | Age 16-19
In terms of in labor force | age 16-19, the demographic groups most similar to Spanish Americans are Osage (39.0%, a difference of 0.090%), Immigrants from Burma/Myanmar (39.0%, a difference of 0.15%), Blackfeet (38.9%, a difference of 0.15%), Immigrants from Canada (38.9%, a difference of 0.15%), and Alaska Native (39.1%, a difference of 0.22%).
| Demographics | Rating | Rank | In Labor Force | Age 16-19 |
| Immigrants | Uganda | 99.7 /100 | #84 | Exceptional 39.2% |
| Creek | 99.6 /100 | #85 | Exceptional 39.1% |
| Samoans | 99.6 /100 | #86 | Exceptional 39.1% |
| Immigrants | Germany | 99.6 /100 | #87 | Exceptional 39.1% |
| Puget Sound Salish | 99.6 /100 | #88 | Exceptional 39.1% |
| Alaska Natives | 99.6 /100 | #89 | Exceptional 39.1% |
| Immigrants | Burma/Myanmar | 99.5 /100 | #90 | Exceptional 39.0% |
| Spanish Americans | 99.5 /100 | #91 | Exceptional 39.0% |
| Osage | 99.4 /100 | #92 | Exceptional 39.0% |
| Blackfeet | 99.4 /100 | #93 | Exceptional 38.9% |
| Immigrants | Canada | 99.4 /100 | #94 | Exceptional 38.9% |
| Immigrants | North America | 99.4 /100 | #95 | Exceptional 38.9% |
| Latvians | 99.4 /100 | #96 | Exceptional 38.9% |
| Greeks | 99.3 /100 | #97 | Exceptional 38.9% |
| Ugandans | 99.3 /100 | #98 | Exceptional 38.9% |