Immigrants from Scotland vs Bahamian In Labor Force | Age 16-19
COMPARE
Immigrants from Scotland
Bahamian
In Labor Force | Age 16-19
In Labor Force | Age 16-19 Comparison
Immigrants from Scotland
Bahamians
38.5%
IN LABOR FORCE | AGE 16-19
98.5/ 100
METRIC RATING
112th/ 347
METRIC RANK
34.6%
IN LABOR FORCE | AGE 16-19
1.4/ 100
METRIC RATING
254th/ 347
METRIC RANK
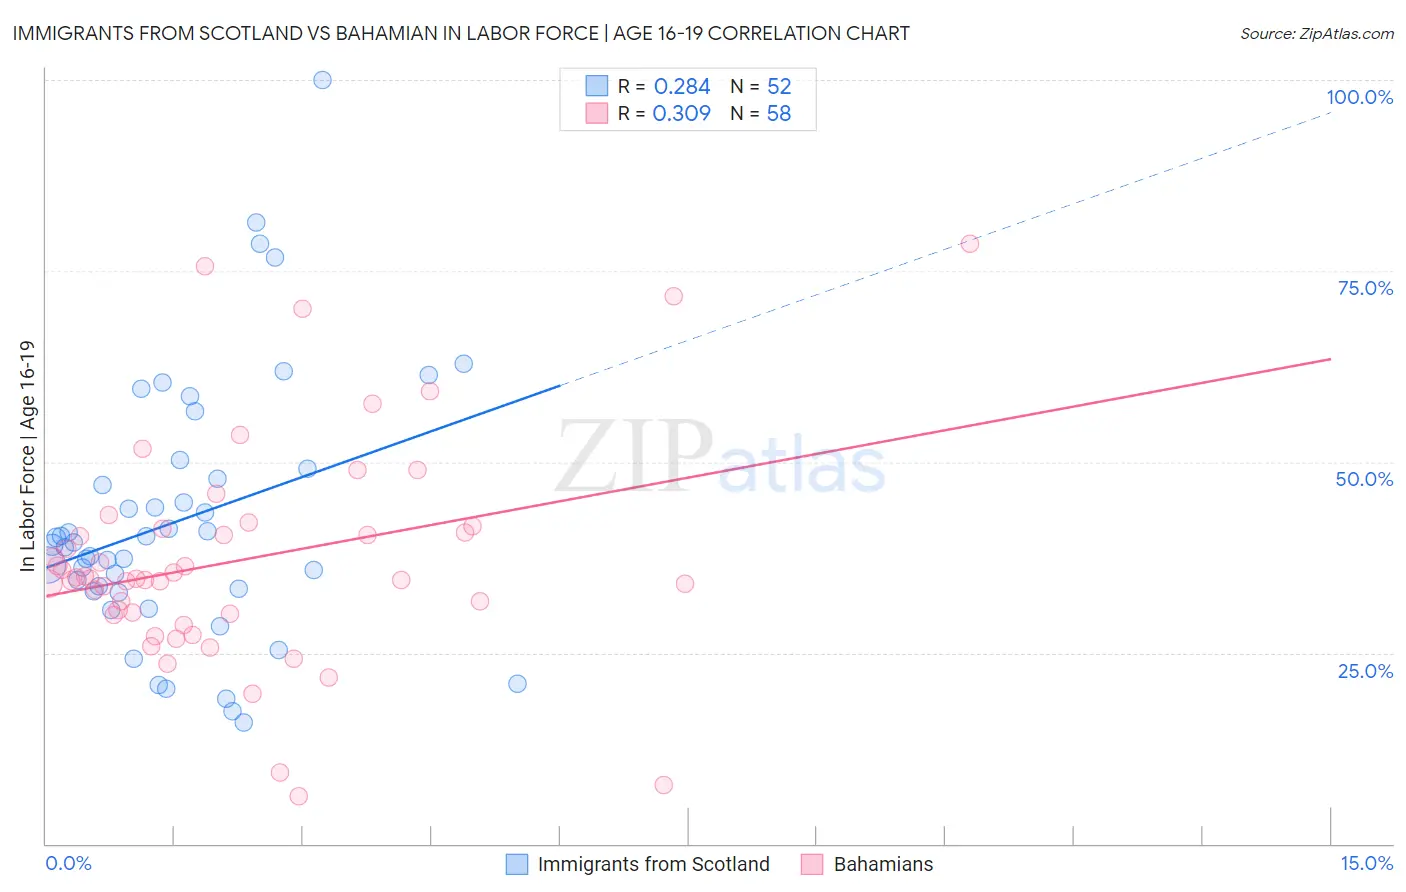
Immigrants from Scotland vs Bahamian In Labor Force | Age 16-19 Correlation Chart
The statistical analysis conducted on geographies consisting of 196,210,607 people shows a weak positive correlation between the proportion of Immigrants from Scotland and labor force participation rate among population between the ages 16 and 19 in the United States with a correlation coefficient (R) of 0.284 and weighted average of 38.5%. Similarly, the statistical analysis conducted on geographies consisting of 112,651,679 people shows a mild positive correlation between the proportion of Bahamians and labor force participation rate among population between the ages 16 and 19 in the United States with a correlation coefficient (R) of 0.309 and weighted average of 34.6%, a difference of 11.2%.
In Labor Force | Age 16-19 Correlation Summary
| Measurement | Immigrants from Scotland | Bahamian |
| Minimum | 15.9% | 6.3% |
| Maximum | 100.0% | 78.5% |
| Range | 84.1% | 72.2% |
| Mean | 42.4% | 37.1% |
| Median | 39.3% | 34.6% |
| Interquartile 25% (IQ1) | 33.2% | 30.1% |
| Interquartile 75% (IQ3) | 48.5% | 41.2% |
| Interquartile Range (IQR) | 15.3% | 11.1% |
| Standard Deviation (Sample) | 17.1% | 14.4% |
| Standard Deviation (Population) | 16.9% | 14.3% |
Similar Demographics by In Labor Force | Age 16-19
Demographics Similar to Immigrants from Scotland by In Labor Force | Age 16-19
In terms of in labor force | age 16-19, the demographic groups most similar to Immigrants from Scotland are Crow (38.5%, a difference of 0.010%), Maltese (38.5%, a difference of 0.070%), Subsaharan African (38.4%, a difference of 0.13%), Lebanese (38.6%, a difference of 0.19%), and Immigrants from Ethiopia (38.6%, a difference of 0.20%).
| Demographics | Rating | Rank | In Labor Force | Age 16-19 |
| Iraqis | 98.9 /100 | #105 | Exceptional 38.6% |
| Delaware | 98.8 /100 | #106 | Exceptional 38.6% |
| Chinese | 98.8 /100 | #107 | Exceptional 38.6% |
| Immigrants | Ethiopia | 98.7 /100 | #108 | Exceptional 38.6% |
| Lebanese | 98.7 /100 | #109 | Exceptional 38.6% |
| Maltese | 98.6 /100 | #110 | Exceptional 38.5% |
| Crow | 98.5 /100 | #111 | Exceptional 38.5% |
| Immigrants | Scotland | 98.5 /100 | #112 | Exceptional 38.5% |
| Sub-Saharan Africans | 98.3 /100 | #113 | Exceptional 38.4% |
| Hawaiians | 98.2 /100 | #114 | Exceptional 38.4% |
| Bulgarians | 97.9 /100 | #115 | Exceptional 38.3% |
| Colville | 97.9 /100 | #116 | Exceptional 38.3% |
| Chickasaw | 97.8 /100 | #117 | Exceptional 38.3% |
| Immigrants | Nepal | 97.8 /100 | #118 | Exceptional 38.3% |
| Assyrians/Chaldeans/Syriacs | 97.8 /100 | #119 | Exceptional 38.3% |
Demographics Similar to Bahamians by In Labor Force | Age 16-19
In terms of in labor force | age 16-19, the demographic groups most similar to Bahamians are Peruvian (34.6%, a difference of 0.040%), Immigrants from Japan (34.7%, a difference of 0.12%), Immigrants from South Central Asia (34.6%, a difference of 0.15%), Immigrants from Egypt (34.6%, a difference of 0.15%), and Thai (34.6%, a difference of 0.16%).
| Demographics | Rating | Rank | In Labor Force | Age 16-19 |
| Laotians | 2.4 /100 | #247 | Tragic 34.9% |
| Central Americans | 2.2 /100 | #248 | Tragic 34.8% |
| Immigrants | Ukraine | 2.2 /100 | #249 | Tragic 34.8% |
| Immigrants | Pakistan | 2.0 /100 | #250 | Tragic 34.8% |
| Immigrants | Western Asia | 2.0 /100 | #251 | Tragic 34.8% |
| Immigrants | Chile | 2.0 /100 | #252 | Tragic 34.8% |
| Immigrants | Japan | 1.5 /100 | #253 | Tragic 34.7% |
| Bahamians | 1.4 /100 | #254 | Tragic 34.6% |
| Peruvians | 1.4 /100 | #255 | Tragic 34.6% |
| Immigrants | South Central Asia | 1.3 /100 | #256 | Tragic 34.6% |
| Immigrants | Egypt | 1.2 /100 | #257 | Tragic 34.6% |
| Thais | 1.2 /100 | #258 | Tragic 34.6% |
| Immigrants | Immigrants | 1.2 /100 | #259 | Tragic 34.6% |
| Egyptians | 1.2 /100 | #260 | Tragic 34.5% |
| Salvadorans | 1.1 /100 | #261 | Tragic 34.5% |