Menominee vs Spanish American In Labor Force | Age 16-19
COMPARE
Menominee
Spanish American
In Labor Force | Age 16-19
In Labor Force | Age 16-19 Comparison
Menominee
Spanish Americans
33.9%
IN LABOR FORCE | AGE 16-19
0.3/ 100
METRIC RATING
277th/ 347
METRIC RANK
39.0%
IN LABOR FORCE | AGE 16-19
99.5/ 100
METRIC RATING
91st/ 347
METRIC RANK
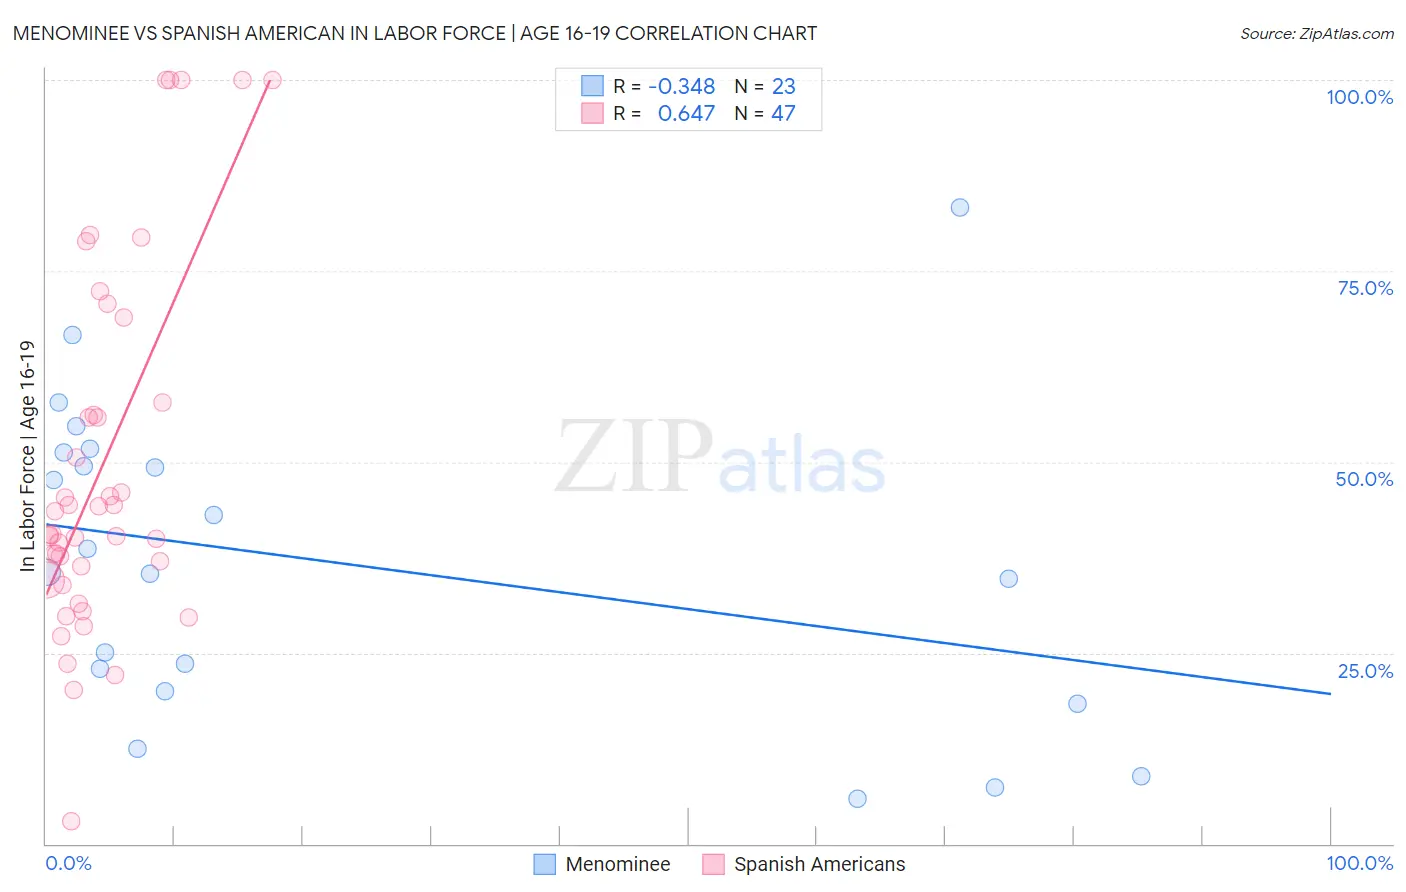
Menominee vs Spanish American In Labor Force | Age 16-19 Correlation Chart
The statistical analysis conducted on geographies consisting of 45,771,172 people shows a mild negative correlation between the proportion of Menominee and labor force participation rate among population between the ages 16 and 19 in the United States with a correlation coefficient (R) of -0.348 and weighted average of 33.9%. Similarly, the statistical analysis conducted on geographies consisting of 103,105,660 people shows a significant positive correlation between the proportion of Spanish Americans and labor force participation rate among population between the ages 16 and 19 in the United States with a correlation coefficient (R) of 0.647 and weighted average of 39.0%, a difference of 15.2%.
In Labor Force | Age 16-19 Correlation Summary
| Measurement | Menominee | Spanish American |
| Minimum | 5.9% | 3.0% |
| Maximum | 83.3% | 100.0% |
| Range | 77.4% | 97.0% |
| Mean | 36.7% | 49.4% |
| Median | 35.5% | 40.5% |
| Interquartile 25% (IQ1) | 20.0% | 34.6% |
| Interquartile 75% (IQ3) | 51.3% | 57.8% |
| Interquartile Range (IQR) | 31.3% | 23.2% |
| Standard Deviation (Sample) | 20.3% | 23.7% |
| Standard Deviation (Population) | 19.8% | 23.4% |
Similar Demographics by In Labor Force | Age 16-19
Demographics Similar to Menominee by In Labor Force | Age 16-19
In terms of in labor force | age 16-19, the demographic groups most similar to Menominee are Colombian (33.8%, a difference of 0.070%), Paraguayan (33.8%, a difference of 0.080%), Taiwanese (33.8%, a difference of 0.090%), Cypriot (33.8%, a difference of 0.10%), and Immigrants from Latin America (33.9%, a difference of 0.11%).
| Demographics | Rating | Rank | In Labor Force | Age 16-19 |
| Immigrants | Russia | 0.4 /100 | #270 | Tragic 34.1% |
| Central American Indians | 0.4 /100 | #271 | Tragic 34.1% |
| Asians | 0.4 /100 | #272 | Tragic 34.1% |
| Immigrants | Panama | 0.4 /100 | #273 | Tragic 34.0% |
| Venezuelans | 0.3 /100 | #274 | Tragic 34.0% |
| Immigrants | Fiji | 0.3 /100 | #275 | Tragic 33.9% |
| Immigrants | Latin America | 0.3 /100 | #276 | Tragic 33.9% |
| Menominee | 0.3 /100 | #277 | Tragic 33.9% |
| Colombians | 0.3 /100 | #278 | Tragic 33.8% |
| Paraguayans | 0.3 /100 | #279 | Tragic 33.8% |
| Taiwanese | 0.3 /100 | #280 | Tragic 33.8% |
| Cypriots | 0.3 /100 | #281 | Tragic 33.8% |
| Immigrants | Korea | 0.3 /100 | #282 | Tragic 33.8% |
| Immigrants | Venezuela | 0.2 /100 | #283 | Tragic 33.7% |
| Immigrants | Spain | 0.2 /100 | #284 | Tragic 33.7% |
Demographics Similar to Spanish Americans by In Labor Force | Age 16-19
In terms of in labor force | age 16-19, the demographic groups most similar to Spanish Americans are Osage (39.0%, a difference of 0.090%), Immigrants from Burma/Myanmar (39.0%, a difference of 0.15%), Blackfeet (38.9%, a difference of 0.15%), Immigrants from Canada (38.9%, a difference of 0.15%), and Alaska Native (39.1%, a difference of 0.22%).
| Demographics | Rating | Rank | In Labor Force | Age 16-19 |
| Immigrants | Uganda | 99.7 /100 | #84 | Exceptional 39.2% |
| Creek | 99.6 /100 | #85 | Exceptional 39.1% |
| Samoans | 99.6 /100 | #86 | Exceptional 39.1% |
| Immigrants | Germany | 99.6 /100 | #87 | Exceptional 39.1% |
| Puget Sound Salish | 99.6 /100 | #88 | Exceptional 39.1% |
| Alaska Natives | 99.6 /100 | #89 | Exceptional 39.1% |
| Immigrants | Burma/Myanmar | 99.5 /100 | #90 | Exceptional 39.0% |
| Spanish Americans | 99.5 /100 | #91 | Exceptional 39.0% |
| Osage | 99.4 /100 | #92 | Exceptional 39.0% |
| Blackfeet | 99.4 /100 | #93 | Exceptional 38.9% |
| Immigrants | Canada | 99.4 /100 | #94 | Exceptional 38.9% |
| Immigrants | North America | 99.4 /100 | #95 | Exceptional 38.9% |
| Latvians | 99.4 /100 | #96 | Exceptional 38.9% |
| Greeks | 99.3 /100 | #97 | Exceptional 38.9% |
| Ugandans | 99.3 /100 | #98 | Exceptional 38.9% |