Sioux vs Spanish American In Labor Force | Age 16-19
COMPARE
Sioux
Spanish American
In Labor Force | Age 16-19
In Labor Force | Age 16-19 Comparison
Sioux
Spanish Americans
41.5%
IN LABOR FORCE | AGE 16-19
100.0/ 100
METRIC RATING
38th/ 347
METRIC RANK
39.0%
IN LABOR FORCE | AGE 16-19
99.5/ 100
METRIC RATING
91st/ 347
METRIC RANK
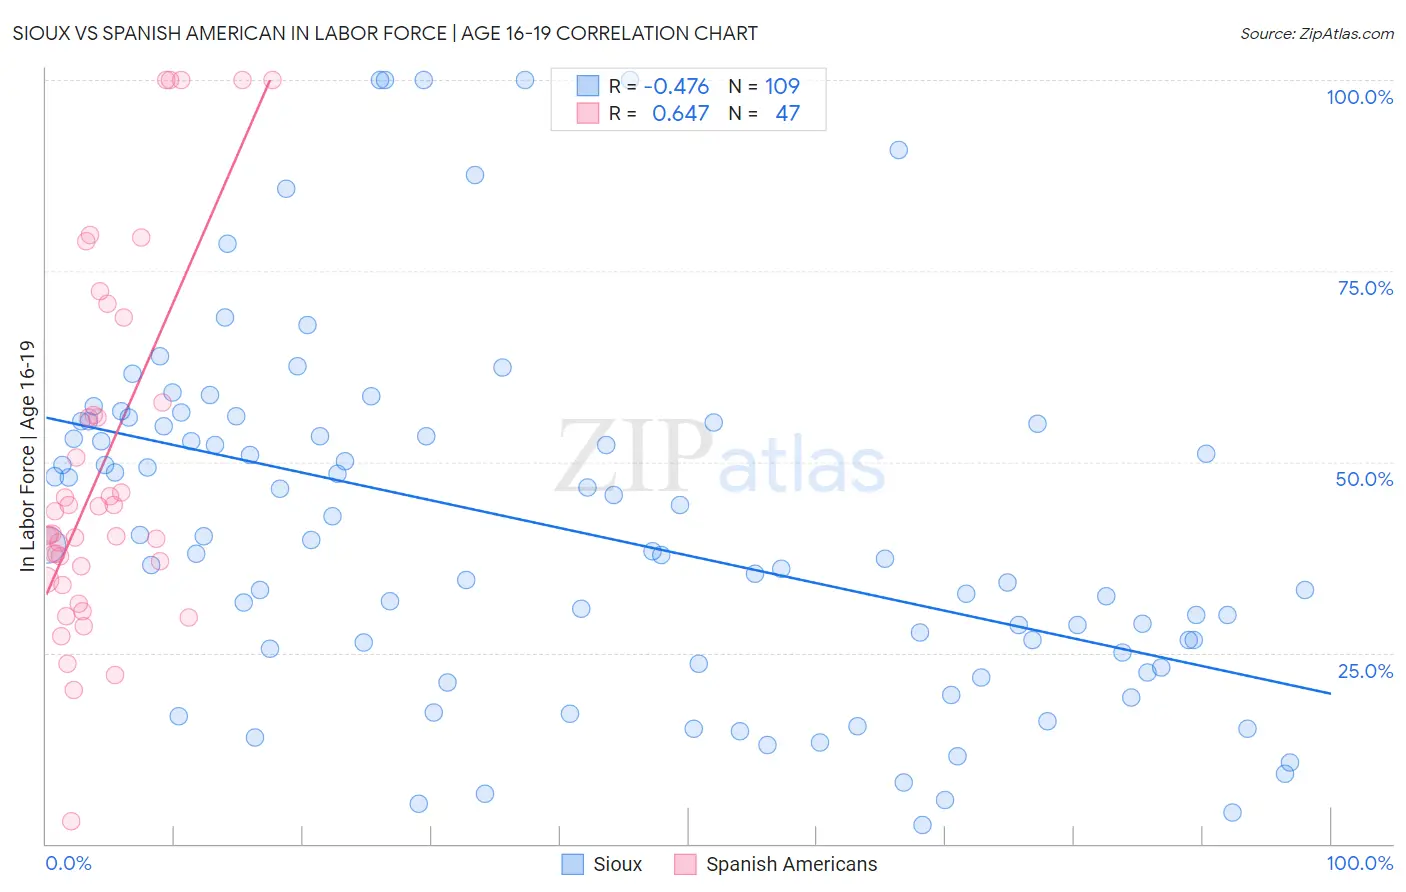
Sioux vs Spanish American In Labor Force | Age 16-19 Correlation Chart
The statistical analysis conducted on geographies consisting of 233,888,038 people shows a moderate negative correlation between the proportion of Sioux and labor force participation rate among population between the ages 16 and 19 in the United States with a correlation coefficient (R) of -0.476 and weighted average of 41.5%. Similarly, the statistical analysis conducted on geographies consisting of 103,105,660 people shows a significant positive correlation between the proportion of Spanish Americans and labor force participation rate among population between the ages 16 and 19 in the United States with a correlation coefficient (R) of 0.647 and weighted average of 39.0%, a difference of 6.6%.
In Labor Force | Age 16-19 Correlation Summary
| Measurement | Sioux | Spanish American |
| Minimum | 2.4% | 3.0% |
| Maximum | 100.0% | 100.0% |
| Range | 97.6% | 97.0% |
| Mean | 41.1% | 49.4% |
| Median | 38.3% | 40.5% |
| Interquartile 25% (IQ1) | 24.2% | 34.6% |
| Interquartile 75% (IQ3) | 54.9% | 57.8% |
| Interquartile Range (IQR) | 30.6% | 23.2% |
| Standard Deviation (Sample) | 23.0% | 23.7% |
| Standard Deviation (Population) | 22.9% | 23.4% |
Similar Demographics by In Labor Force | Age 16-19
Demographics Similar to Sioux by In Labor Force | Age 16-19
In terms of in labor force | age 16-19, the demographic groups most similar to Sioux are Scotch-Irish (41.5%, a difference of 0.14%), Immigrants from Liberia (41.5%, a difference of 0.23%), Immigrants from Congo (41.7%, a difference of 0.35%), Immigrants from the Azores (41.7%, a difference of 0.42%), and Yugoslavian (41.8%, a difference of 0.57%).
| Demographics | Rating | Rank | In Labor Force | Age 16-19 |
| Irish | 100.0 /100 | #31 | Exceptional 42.0% |
| Czechoslovakians | 100.0 /100 | #32 | Exceptional 41.9% |
| Liberians | 100.0 /100 | #33 | Exceptional 41.8% |
| Immigrants | Bosnia and Herzegovina | 100.0 /100 | #34 | Exceptional 41.8% |
| Yugoslavians | 100.0 /100 | #35 | Exceptional 41.8% |
| Immigrants | Azores | 100.0 /100 | #36 | Exceptional 41.7% |
| Immigrants | Congo | 100.0 /100 | #37 | Exceptional 41.7% |
| Sioux | 100.0 /100 | #38 | Exceptional 41.5% |
| Scotch-Irish | 100.0 /100 | #39 | Exceptional 41.5% |
| Immigrants | Liberia | 100.0 /100 | #40 | Exceptional 41.5% |
| Celtics | 100.0 /100 | #41 | Exceptional 41.3% |
| Whites/Caucasians | 100.0 /100 | #42 | Exceptional 41.3% |
| Tongans | 100.0 /100 | #43 | Exceptional 41.2% |
| Europeans | 100.0 /100 | #44 | Exceptional 41.1% |
| Croatians | 100.0 /100 | #45 | Exceptional 41.1% |
Demographics Similar to Spanish Americans by In Labor Force | Age 16-19
In terms of in labor force | age 16-19, the demographic groups most similar to Spanish Americans are Osage (39.0%, a difference of 0.090%), Immigrants from Burma/Myanmar (39.0%, a difference of 0.15%), Blackfeet (38.9%, a difference of 0.15%), Immigrants from Canada (38.9%, a difference of 0.15%), and Alaska Native (39.1%, a difference of 0.22%).
| Demographics | Rating | Rank | In Labor Force | Age 16-19 |
| Immigrants | Uganda | 99.7 /100 | #84 | Exceptional 39.2% |
| Creek | 99.6 /100 | #85 | Exceptional 39.1% |
| Samoans | 99.6 /100 | #86 | Exceptional 39.1% |
| Immigrants | Germany | 99.6 /100 | #87 | Exceptional 39.1% |
| Puget Sound Salish | 99.6 /100 | #88 | Exceptional 39.1% |
| Alaska Natives | 99.6 /100 | #89 | Exceptional 39.1% |
| Immigrants | Burma/Myanmar | 99.5 /100 | #90 | Exceptional 39.0% |
| Spanish Americans | 99.5 /100 | #91 | Exceptional 39.0% |
| Osage | 99.4 /100 | #92 | Exceptional 39.0% |
| Blackfeet | 99.4 /100 | #93 | Exceptional 38.9% |
| Immigrants | Canada | 99.4 /100 | #94 | Exceptional 38.9% |
| Immigrants | North America | 99.4 /100 | #95 | Exceptional 38.9% |
| Latvians | 99.4 /100 | #96 | Exceptional 38.9% |
| Greeks | 99.3 /100 | #97 | Exceptional 38.9% |
| Ugandans | 99.3 /100 | #98 | Exceptional 38.9% |