Immigrants from Scotland vs Spanish American In Labor Force | Age 25-29
COMPARE
Immigrants from Scotland
Spanish American
In Labor Force | Age 25-29
In Labor Force | Age 25-29 Comparison
Immigrants from Scotland
Spanish Americans
85.4%
IN LABOR FORCE | AGE 25-29
99.3/ 100
METRIC RATING
66th/ 347
METRIC RANK
83.4%
IN LABOR FORCE | AGE 25-29
0.0/ 100
METRIC RATING
267th/ 347
METRIC RANK
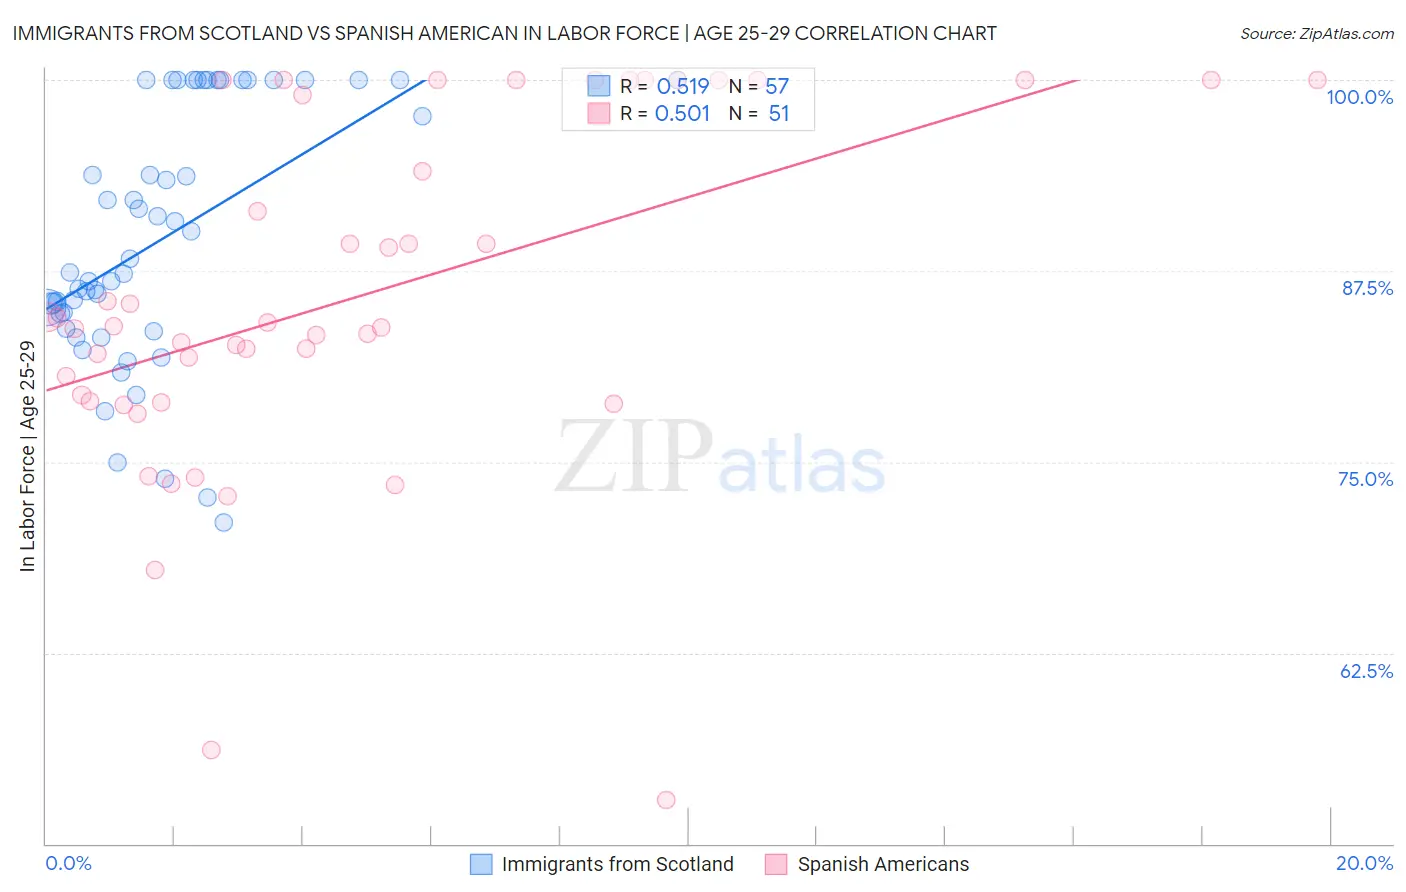
Immigrants from Scotland vs Spanish American In Labor Force | Age 25-29 Correlation Chart
The statistical analysis conducted on geographies consisting of 196,358,343 people shows a substantial positive correlation between the proportion of Immigrants from Scotland and labor force participation rate among population between the ages 25 and 29 in the United States with a correlation coefficient (R) of 0.519 and weighted average of 85.4%. Similarly, the statistical analysis conducted on geographies consisting of 103,156,103 people shows a substantial positive correlation between the proportion of Spanish Americans and labor force participation rate among population between the ages 25 and 29 in the United States with a correlation coefficient (R) of 0.501 and weighted average of 83.4%, a difference of 2.4%.
In Labor Force | Age 25-29 Correlation Summary
| Measurement | Immigrants from Scotland | Spanish American |
| Minimum | 71.0% | 52.9% |
| Maximum | 100.0% | 100.0% |
| Range | 29.0% | 47.1% |
| Mean | 89.6% | 85.8% |
| Median | 87.4% | 83.9% |
| Interquartile 25% (IQ1) | 84.2% | 79.0% |
| Interquartile 75% (IQ3) | 100.0% | 100.0% |
| Interquartile Range (IQR) | 15.8% | 21.0% |
| Standard Deviation (Sample) | 8.3% | 11.3% |
| Standard Deviation (Population) | 8.2% | 11.2% |
Similar Demographics by In Labor Force | Age 25-29
Demographics Similar to Immigrants from Scotland by In Labor Force | Age 25-29
In terms of in labor force | age 25-29, the demographic groups most similar to Immigrants from Scotland are Immigrants from Italy (85.4%, a difference of 0.010%), Immigrants from Czechoslovakia (85.4%, a difference of 0.010%), Immigrants from Turkey (85.4%, a difference of 0.010%), Immigrants from Cameroon (85.4%, a difference of 0.020%), and Immigrants from Kenya (85.4%, a difference of 0.030%).
| Demographics | Rating | Rank | In Labor Force | Age 25-29 |
| Immigrants | Morocco | 99.5 /100 | #59 | Exceptional 85.5% |
| Thais | 99.5 /100 | #60 | Exceptional 85.5% |
| Serbians | 99.5 /100 | #61 | Exceptional 85.5% |
| Taiwanese | 99.4 /100 | #62 | Exceptional 85.4% |
| Immigrants | Kenya | 99.4 /100 | #63 | Exceptional 85.4% |
| Immigrants | Italy | 99.3 /100 | #64 | Exceptional 85.4% |
| Immigrants | Czechoslovakia | 99.3 /100 | #65 | Exceptional 85.4% |
| Immigrants | Scotland | 99.3 /100 | #66 | Exceptional 85.4% |
| Immigrants | Turkey | 99.2 /100 | #67 | Exceptional 85.4% |
| Immigrants | Cameroon | 99.2 /100 | #68 | Exceptional 85.4% |
| Menominee | 99.1 /100 | #69 | Exceptional 85.4% |
| Immigrants | Sweden | 99.1 /100 | #70 | Exceptional 85.4% |
| Kenyans | 99.0 /100 | #71 | Exceptional 85.4% |
| Immigrants | Australia | 98.9 /100 | #72 | Exceptional 85.3% |
| Russians | 98.8 /100 | #73 | Exceptional 85.3% |
Demographics Similar to Spanish Americans by In Labor Force | Age 25-29
In terms of in labor force | age 25-29, the demographic groups most similar to Spanish Americans are Aleut (83.4%, a difference of 0.010%), Immigrants from Lebanon (83.4%, a difference of 0.010%), Immigrants from Barbados (83.4%, a difference of 0.010%), Basque (83.4%, a difference of 0.020%), and Puget Sound Salish (83.5%, a difference of 0.050%).
| Demographics | Rating | Rank | In Labor Force | Age 25-29 |
| Immigrants | Bahamas | 0.1 /100 | #260 | Tragic 83.6% |
| Pennsylvania Germans | 0.1 /100 | #261 | Tragic 83.6% |
| Immigrants | Fiji | 0.1 /100 | #262 | Tragic 83.6% |
| West Indians | 0.1 /100 | #263 | Tragic 83.5% |
| Puget Sound Salish | 0.1 /100 | #264 | Tragic 83.5% |
| Cubans | 0.1 /100 | #265 | Tragic 83.5% |
| Aleuts | 0.0 /100 | #266 | Tragic 83.4% |
| Spanish Americans | 0.0 /100 | #267 | Tragic 83.4% |
| Immigrants | Lebanon | 0.0 /100 | #268 | Tragic 83.4% |
| Immigrants | Barbados | 0.0 /100 | #269 | Tragic 83.4% |
| Basques | 0.0 /100 | #270 | Tragic 83.4% |
| Hondurans | 0.0 /100 | #271 | Tragic 83.4% |
| Immigrants | Caribbean | 0.0 /100 | #272 | Tragic 83.4% |
| Immigrants | Dominica | 0.0 /100 | #273 | Tragic 83.4% |
| Marshallese | 0.0 /100 | #274 | Tragic 83.3% |