Immigrants from Scotland vs Belgian In Labor Force | Age 16-19
COMPARE
Immigrants from Scotland
Belgian
In Labor Force | Age 16-19
In Labor Force | Age 16-19 Comparison
Immigrants from Scotland
Belgians
38.5%
IN LABOR FORCE | AGE 16-19
98.5/ 100
METRIC RATING
112th/ 347
METRIC RANK
43.4%
IN LABOR FORCE | AGE 16-19
100.0/ 100
METRIC RATING
19th/ 347
METRIC RANK
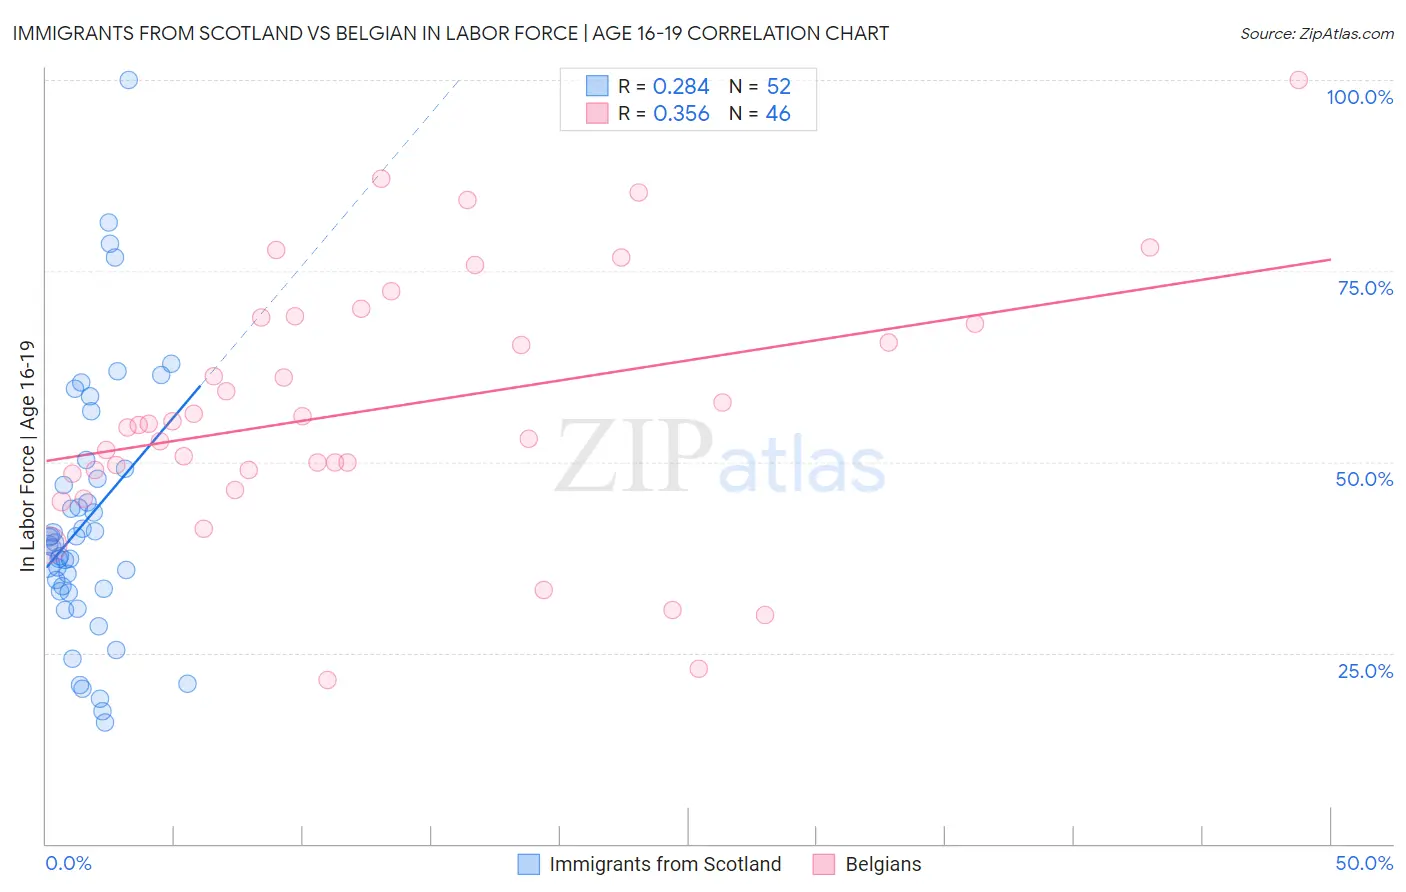
Immigrants from Scotland vs Belgian In Labor Force | Age 16-19 Correlation Chart
The statistical analysis conducted on geographies consisting of 196,210,607 people shows a weak positive correlation between the proportion of Immigrants from Scotland and labor force participation rate among population between the ages 16 and 19 in the United States with a correlation coefficient (R) of 0.284 and weighted average of 38.5%. Similarly, the statistical analysis conducted on geographies consisting of 355,384,811 people shows a mild positive correlation between the proportion of Belgians and labor force participation rate among population between the ages 16 and 19 in the United States with a correlation coefficient (R) of 0.356 and weighted average of 43.4%, a difference of 12.7%.
In Labor Force | Age 16-19 Correlation Summary
| Measurement | Immigrants from Scotland | Belgian |
| Minimum | 15.9% | 21.5% |
| Maximum | 100.0% | 100.0% |
| Range | 84.1% | 78.5% |
| Mean | 42.4% | 57.1% |
| Median | 39.3% | 54.9% |
| Interquartile 25% (IQ1) | 33.2% | 49.0% |
| Interquartile 75% (IQ3) | 48.5% | 68.9% |
| Interquartile Range (IQR) | 15.3% | 19.9% |
| Standard Deviation (Sample) | 17.1% | 16.9% |
| Standard Deviation (Population) | 16.9% | 16.7% |
Similar Demographics by In Labor Force | Age 16-19
Demographics Similar to Immigrants from Scotland by In Labor Force | Age 16-19
In terms of in labor force | age 16-19, the demographic groups most similar to Immigrants from Scotland are Crow (38.5%, a difference of 0.010%), Maltese (38.5%, a difference of 0.070%), Subsaharan African (38.4%, a difference of 0.13%), Lebanese (38.6%, a difference of 0.19%), and Immigrants from Ethiopia (38.6%, a difference of 0.20%).
| Demographics | Rating | Rank | In Labor Force | Age 16-19 |
| Iraqis | 98.9 /100 | #105 | Exceptional 38.6% |
| Delaware | 98.8 /100 | #106 | Exceptional 38.6% |
| Chinese | 98.8 /100 | #107 | Exceptional 38.6% |
| Immigrants | Ethiopia | 98.7 /100 | #108 | Exceptional 38.6% |
| Lebanese | 98.7 /100 | #109 | Exceptional 38.6% |
| Maltese | 98.6 /100 | #110 | Exceptional 38.5% |
| Crow | 98.5 /100 | #111 | Exceptional 38.5% |
| Immigrants | Scotland | 98.5 /100 | #112 | Exceptional 38.5% |
| Sub-Saharan Africans | 98.3 /100 | #113 | Exceptional 38.4% |
| Hawaiians | 98.2 /100 | #114 | Exceptional 38.4% |
| Bulgarians | 97.9 /100 | #115 | Exceptional 38.3% |
| Colville | 97.9 /100 | #116 | Exceptional 38.3% |
| Chickasaw | 97.8 /100 | #117 | Exceptional 38.3% |
| Immigrants | Nepal | 97.8 /100 | #118 | Exceptional 38.3% |
| Assyrians/Chaldeans/Syriacs | 97.8 /100 | #119 | Exceptional 38.3% |
Demographics Similar to Belgians by In Labor Force | Age 16-19
In terms of in labor force | age 16-19, the demographic groups most similar to Belgians are Swiss (43.3%, a difference of 0.22%), French Canadian (43.6%, a difference of 0.51%), Scandinavian (43.6%, a difference of 0.58%), Czech (43.6%, a difference of 0.65%), and Slovene (43.7%, a difference of 0.76%).
| Demographics | Rating | Rank | In Labor Force | Age 16-19 |
| Finns | 100.0 /100 | #12 | Exceptional 43.9% |
| Dutch | 100.0 /100 | #13 | Exceptional 43.8% |
| Chippewa | 100.0 /100 | #14 | Exceptional 43.8% |
| Slovenes | 100.0 /100 | #15 | Exceptional 43.7% |
| Czechs | 100.0 /100 | #16 | Exceptional 43.6% |
| Scandinavians | 100.0 /100 | #17 | Exceptional 43.6% |
| French Canadians | 100.0 /100 | #18 | Exceptional 43.6% |
| Belgians | 100.0 /100 | #19 | Exceptional 43.4% |
| Swiss | 100.0 /100 | #20 | Exceptional 43.3% |
| Ottawa | 100.0 /100 | #21 | Exceptional 43.0% |
| Sudanese | 100.0 /100 | #22 | Exceptional 42.9% |
| Slovaks | 100.0 /100 | #23 | Exceptional 42.6% |
| Bangladeshis | 100.0 /100 | #24 | Exceptional 42.5% |
| German Russians | 100.0 /100 | #25 | Exceptional 42.4% |
| English | 100.0 /100 | #26 | Exceptional 42.4% |