Jordanian vs Spanish American In Labor Force | Age 16-19
COMPARE
Jordanian
Spanish American
In Labor Force | Age 16-19
In Labor Force | Age 16-19 Comparison
Jordanians
Spanish Americans
36.4%
IN LABOR FORCE | AGE 16-19
39.6/ 100
METRIC RATING
181st/ 347
METRIC RANK
39.0%
IN LABOR FORCE | AGE 16-19
99.5/ 100
METRIC RATING
91st/ 347
METRIC RANK
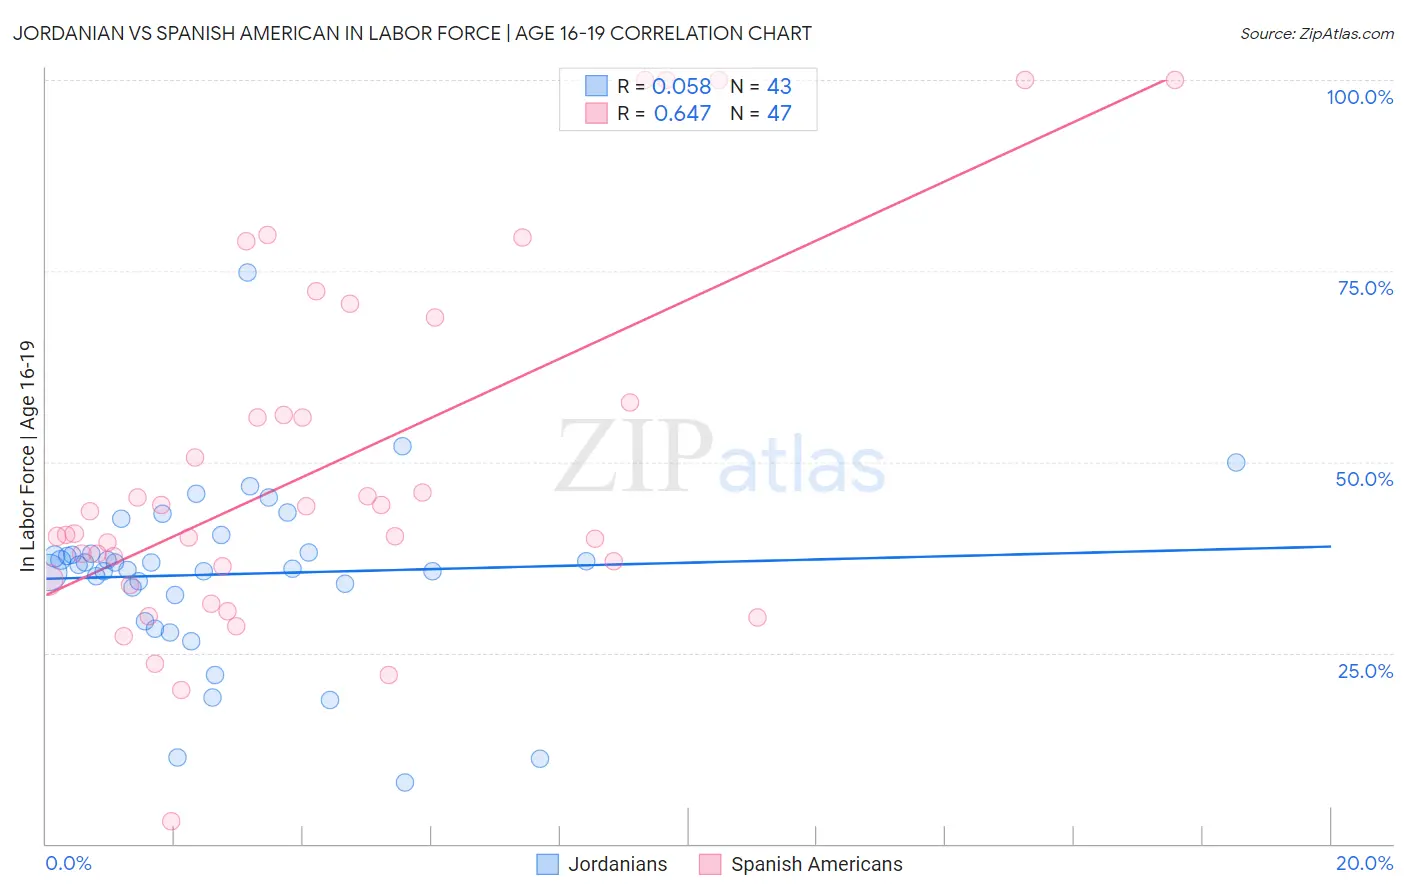
Jordanian vs Spanish American In Labor Force | Age 16-19 Correlation Chart
The statistical analysis conducted on geographies consisting of 166,360,707 people shows a slight positive correlation between the proportion of Jordanians and labor force participation rate among population between the ages 16 and 19 in the United States with a correlation coefficient (R) of 0.058 and weighted average of 36.4%. Similarly, the statistical analysis conducted on geographies consisting of 103,105,660 people shows a significant positive correlation between the proportion of Spanish Americans and labor force participation rate among population between the ages 16 and 19 in the United States with a correlation coefficient (R) of 0.647 and weighted average of 39.0%, a difference of 7.2%.
In Labor Force | Age 16-19 Correlation Summary
| Measurement | Jordanian | Spanish American |
| Minimum | 8.0% | 3.0% |
| Maximum | 74.8% | 100.0% |
| Range | 66.8% | 97.0% |
| Mean | 35.3% | 49.4% |
| Median | 36.5% | 40.5% |
| Interquartile 25% (IQ1) | 32.5% | 34.6% |
| Interquartile 75% (IQ3) | 38.2% | 57.8% |
| Interquartile Range (IQR) | 5.7% | 23.2% |
| Standard Deviation (Sample) | 11.5% | 23.7% |
| Standard Deviation (Population) | 11.3% | 23.4% |
Similar Demographics by In Labor Force | Age 16-19
Demographics Similar to Jordanians by In Labor Force | Age 16-19
In terms of in labor force | age 16-19, the demographic groups most similar to Jordanians are Immigrants from Italy (36.4%, a difference of 0.030%), Eastern European (36.4%, a difference of 0.040%), Immigrants from Morocco (36.4%, a difference of 0.080%), Costa Rican (36.3%, a difference of 0.19%), and Immigrants from Southern Europe (36.4%, a difference of 0.20%).
| Demographics | Rating | Rank | In Labor Force | Age 16-19 |
| Immigrants | Czechoslovakia | 50.0 /100 | #174 | Average 36.6% |
| Natives/Alaskans | 49.0 /100 | #175 | Average 36.6% |
| Albanians | 48.8 /100 | #176 | Average 36.5% |
| Immigrants | Northern Europe | 46.6 /100 | #177 | Average 36.5% |
| Blacks/African Americans | 45.1 /100 | #178 | Average 36.5% |
| Immigrants | Southern Europe | 43.3 /100 | #179 | Average 36.4% |
| Immigrants | Morocco | 41.1 /100 | #180 | Average 36.4% |
| Jordanians | 39.6 /100 | #181 | Fair 36.4% |
| Immigrants | Italy | 39.1 /100 | #182 | Fair 36.4% |
| Eastern Europeans | 38.8 /100 | #183 | Fair 36.4% |
| Costa Ricans | 36.1 /100 | #184 | Fair 36.3% |
| Bhutanese | 35.3 /100 | #185 | Fair 36.3% |
| Immigrants | Romania | 34.0 /100 | #186 | Fair 36.3% |
| Immigrants | Afghanistan | 34.0 /100 | #187 | Fair 36.3% |
| Immigrants | Europe | 31.8 /100 | #188 | Fair 36.2% |
Demographics Similar to Spanish Americans by In Labor Force | Age 16-19
In terms of in labor force | age 16-19, the demographic groups most similar to Spanish Americans are Osage (39.0%, a difference of 0.090%), Immigrants from Burma/Myanmar (39.0%, a difference of 0.15%), Blackfeet (38.9%, a difference of 0.15%), Immigrants from Canada (38.9%, a difference of 0.15%), and Alaska Native (39.1%, a difference of 0.22%).
| Demographics | Rating | Rank | In Labor Force | Age 16-19 |
| Immigrants | Uganda | 99.7 /100 | #84 | Exceptional 39.2% |
| Creek | 99.6 /100 | #85 | Exceptional 39.1% |
| Samoans | 99.6 /100 | #86 | Exceptional 39.1% |
| Immigrants | Germany | 99.6 /100 | #87 | Exceptional 39.1% |
| Puget Sound Salish | 99.6 /100 | #88 | Exceptional 39.1% |
| Alaska Natives | 99.6 /100 | #89 | Exceptional 39.1% |
| Immigrants | Burma/Myanmar | 99.5 /100 | #90 | Exceptional 39.0% |
| Spanish Americans | 99.5 /100 | #91 | Exceptional 39.0% |
| Osage | 99.4 /100 | #92 | Exceptional 39.0% |
| Blackfeet | 99.4 /100 | #93 | Exceptional 38.9% |
| Immigrants | Canada | 99.4 /100 | #94 | Exceptional 38.9% |
| Immigrants | North America | 99.4 /100 | #95 | Exceptional 38.9% |
| Latvians | 99.4 /100 | #96 | Exceptional 38.9% |
| Greeks | 99.3 /100 | #97 | Exceptional 38.9% |
| Ugandans | 99.3 /100 | #98 | Exceptional 38.9% |