Paraguayan vs Lebanese In Labor Force | Age 20-64
COMPARE
Paraguayan
Lebanese
In Labor Force | Age 20-64
In Labor Force | Age 20-64 Comparison
Paraguayans
Lebanese
80.6%
IN LABOR FORCE | AGE 20-64
99.8/ 100
METRIC RATING
36th/ 347
METRIC RANK
79.1%
IN LABOR FORCE | AGE 20-64
5.1/ 100
METRIC RATING
231st/ 347
METRIC RANK
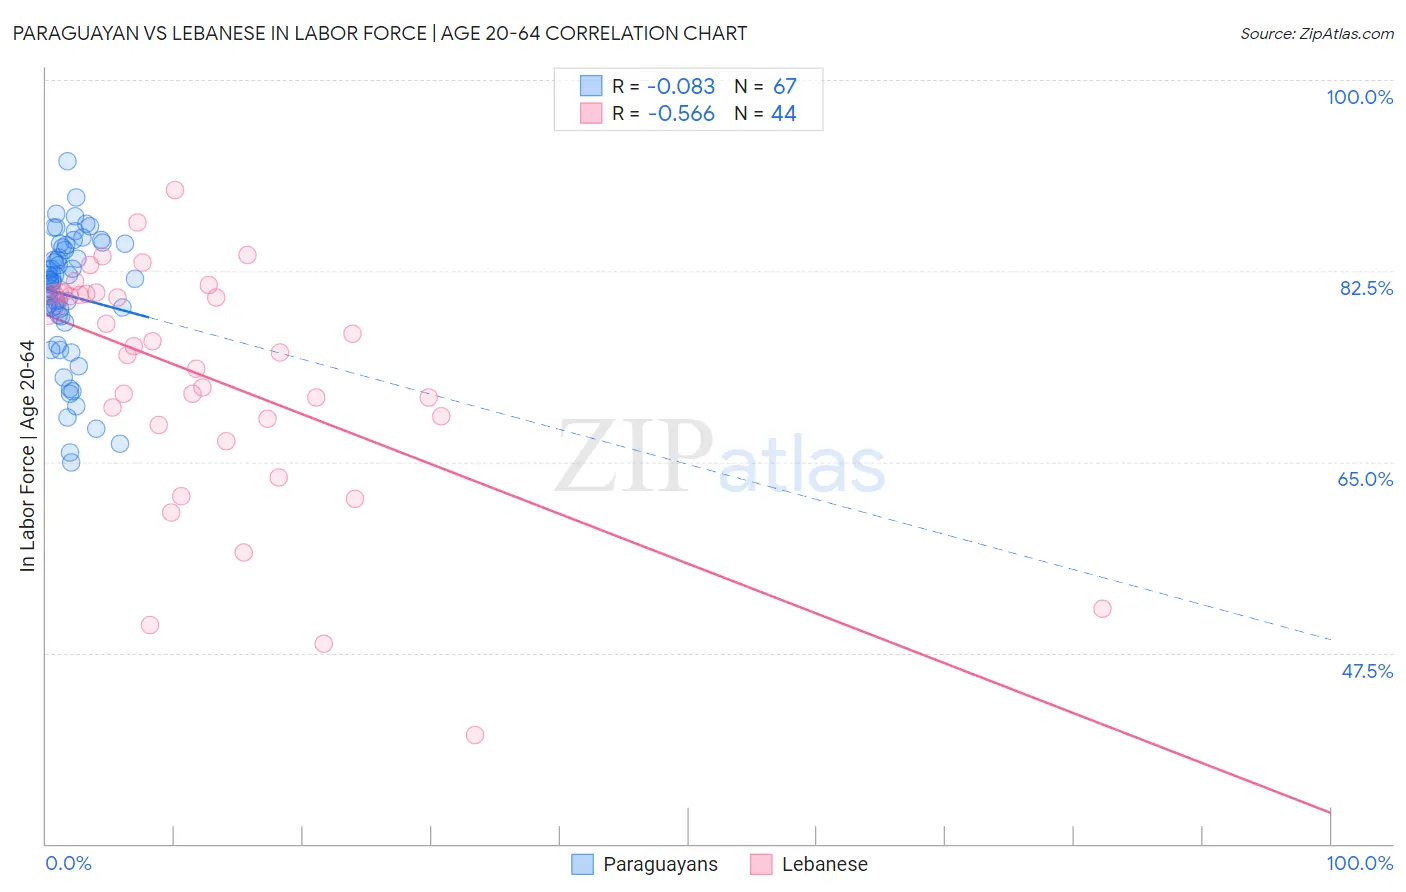
Paraguayan vs Lebanese In Labor Force | Age 20-64 Correlation Chart
The statistical analysis conducted on geographies consisting of 95,114,808 people shows a slight negative correlation between the proportion of Paraguayans and labor force participation rate among population between the ages 20 and 64 in the United States with a correlation coefficient (R) of -0.083 and weighted average of 80.6%. Similarly, the statistical analysis conducted on geographies consisting of 401,626,649 people shows a substantial negative correlation between the proportion of Lebanese and labor force participation rate among population between the ages 20 and 64 in the United States with a correlation coefficient (R) of -0.566 and weighted average of 79.1%, a difference of 1.9%.
In Labor Force | Age 20-64 Correlation Summary
| Measurement | Paraguayan | Lebanese |
| Minimum | 64.9% | 40.0% |
| Maximum | 92.6% | 89.9% |
| Range | 27.7% | 49.9% |
| Mean | 80.3% | 72.7% |
| Median | 81.7% | 75.3% |
| Interquartile 25% (IQ1) | 78.3% | 68.6% |
| Interquartile 75% (IQ3) | 84.6% | 80.5% |
| Interquartile Range (IQR) | 6.3% | 11.9% |
| Standard Deviation (Sample) | 5.9% | 11.0% |
| Standard Deviation (Population) | 5.9% | 10.9% |
Similar Demographics by In Labor Force | Age 20-64
Demographics Similar to Paraguayans by In Labor Force | Age 20-64
In terms of in labor force | age 20-64, the demographic groups most similar to Paraguayans are Immigrants from Moldova (80.6%, a difference of 0.0%), Ugandan (80.6%, a difference of 0.020%), Brazilian (80.5%, a difference of 0.030%), Immigrants from Zimbabwe (80.5%, a difference of 0.030%), and Immigrants from Liberia (80.5%, a difference of 0.050%).
| Demographics | Rating | Rank | In Labor Force | Age 20-64 |
| Immigrants | South Central Asia | 99.9 /100 | #29 | Exceptional 80.7% |
| Immigrants | North Macedonia | 99.9 /100 | #30 | Exceptional 80.7% |
| Immigrants | Lithuania | 99.9 /100 | #31 | Exceptional 80.7% |
| Immigrants | Ireland | 99.9 /100 | #32 | Exceptional 80.7% |
| Chinese | 99.9 /100 | #33 | Exceptional 80.7% |
| Immigrants | Brazil | 99.9 /100 | #34 | Exceptional 80.7% |
| Immigrants | Poland | 99.9 /100 | #35 | Exceptional 80.6% |
| Paraguayans | 99.8 /100 | #36 | Exceptional 80.6% |
| Immigrants | Moldova | 99.8 /100 | #37 | Exceptional 80.6% |
| Ugandans | 99.8 /100 | #38 | Exceptional 80.6% |
| Brazilians | 99.8 /100 | #39 | Exceptional 80.5% |
| Immigrants | Zimbabwe | 99.8 /100 | #40 | Exceptional 80.5% |
| Immigrants | Liberia | 99.8 /100 | #41 | Exceptional 80.5% |
| Latvians | 99.8 /100 | #42 | Exceptional 80.5% |
| Czechs | 99.7 /100 | #43 | Exceptional 80.5% |
Demographics Similar to Lebanese by In Labor Force | Age 20-64
In terms of in labor force | age 20-64, the demographic groups most similar to Lebanese are Panamanian (79.1%, a difference of 0.020%), Alsatian (79.1%, a difference of 0.020%), Native Hawaiian (79.1%, a difference of 0.020%), Guamanian/Chamorro (79.1%, a difference of 0.020%), and Central American (79.1%, a difference of 0.030%).
| Demographics | Rating | Rank | In Labor Force | Age 20-64 |
| Immigrants | Uzbekistan | 6.8 /100 | #224 | Tragic 79.1% |
| Portuguese | 6.4 /100 | #225 | Tragic 79.1% |
| Central Americans | 5.9 /100 | #226 | Tragic 79.1% |
| Immigrants | Western Europe | 5.9 /100 | #227 | Tragic 79.1% |
| Panamanians | 5.7 /100 | #228 | Tragic 79.1% |
| Alsatians | 5.7 /100 | #229 | Tragic 79.1% |
| Native Hawaiians | 5.6 /100 | #230 | Tragic 79.1% |
| Lebanese | 5.1 /100 | #231 | Tragic 79.1% |
| Guamanians/Chamorros | 4.5 /100 | #232 | Tragic 79.1% |
| Japanese | 4.0 /100 | #233 | Tragic 79.1% |
| Immigrants | Canada | 3.2 /100 | #234 | Tragic 79.0% |
| Tlingit-Haida | 3.2 /100 | #235 | Tragic 79.0% |
| Samoans | 2.9 /100 | #236 | Tragic 79.0% |
| Immigrants | North America | 2.9 /100 | #237 | Tragic 79.0% |
| Immigrants | Jamaica | 2.6 /100 | #238 | Tragic 79.0% |