Seminole vs Lebanese In Labor Force | Age 20-64
COMPARE
Seminole
Lebanese
In Labor Force | Age 20-64
In Labor Force | Age 20-64 Comparison
Seminole
Lebanese
75.5%
IN LABOR FORCE | AGE 20-64
0.0/ 100
METRIC RATING
321st/ 347
METRIC RANK
79.1%
IN LABOR FORCE | AGE 20-64
5.1/ 100
METRIC RATING
231st/ 347
METRIC RANK
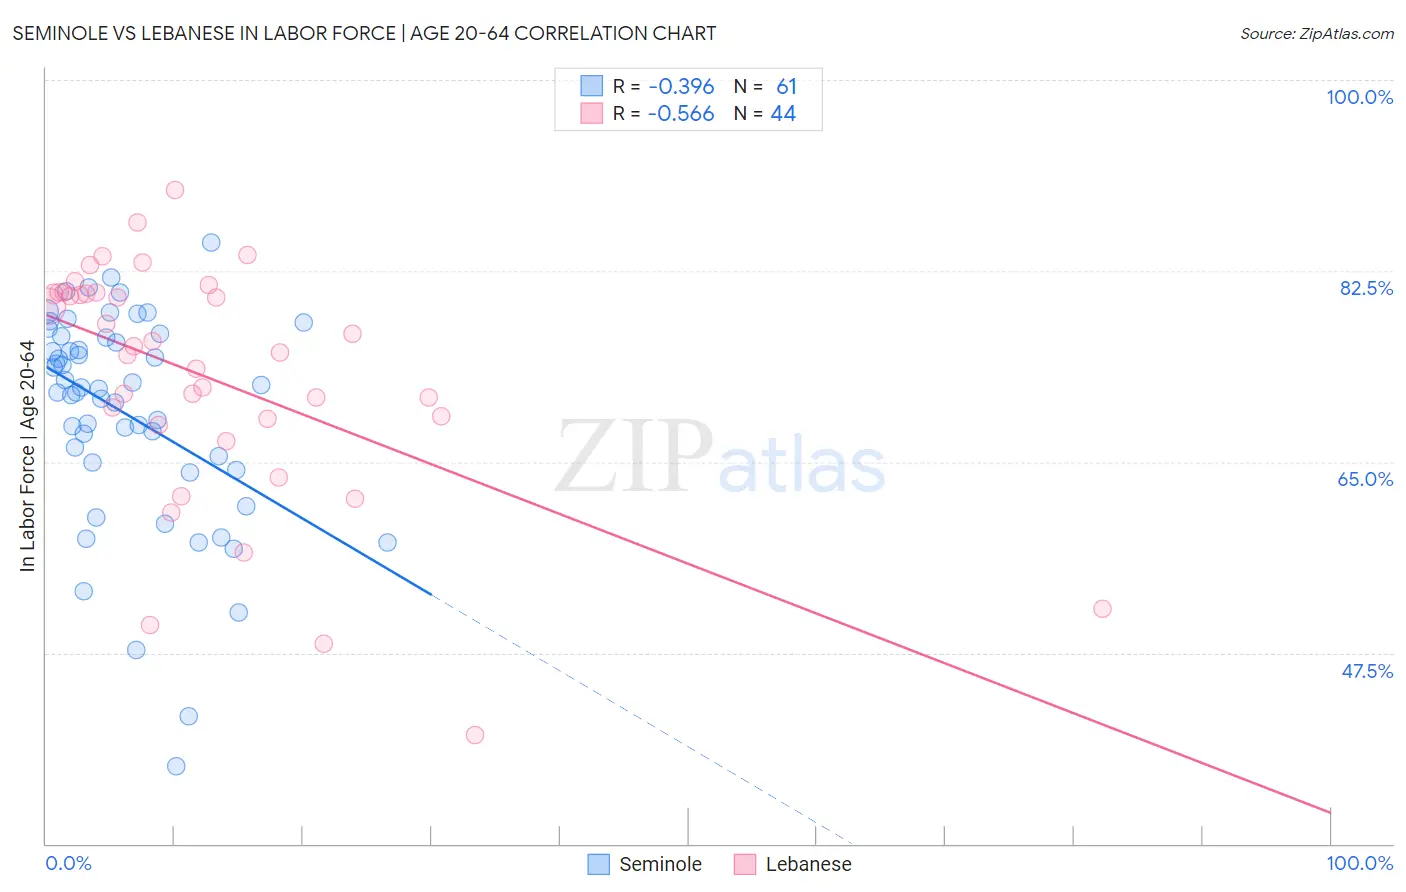
Seminole vs Lebanese In Labor Force | Age 20-64 Correlation Chart
The statistical analysis conducted on geographies consisting of 118,311,145 people shows a mild negative correlation between the proportion of Seminole and labor force participation rate among population between the ages 20 and 64 in the United States with a correlation coefficient (R) of -0.396 and weighted average of 75.5%. Similarly, the statistical analysis conducted on geographies consisting of 401,626,649 people shows a substantial negative correlation between the proportion of Lebanese and labor force participation rate among population between the ages 20 and 64 in the United States with a correlation coefficient (R) of -0.566 and weighted average of 79.1%, a difference of 4.7%.
In Labor Force | Age 20-64 Correlation Summary
| Measurement | Seminole | Lebanese |
| Minimum | 37.1% | 40.0% |
| Maximum | 85.1% | 89.9% |
| Range | 48.0% | 49.9% |
| Mean | 69.3% | 72.7% |
| Median | 71.7% | 75.3% |
| Interquartile 25% (IQ1) | 64.5% | 68.6% |
| Interquartile 75% (IQ3) | 76.5% | 80.5% |
| Interquartile Range (IQR) | 11.9% | 11.9% |
| Standard Deviation (Sample) | 9.9% | 11.0% |
| Standard Deviation (Population) | 9.8% | 10.9% |
Similar Demographics by In Labor Force | Age 20-64
Demographics Similar to Seminole by In Labor Force | Age 20-64
In terms of in labor force | age 20-64, the demographic groups most similar to Seminole are Dutch West Indian (75.5%, a difference of 0.050%), Cajun (75.5%, a difference of 0.090%), Choctaw (75.4%, a difference of 0.14%), Menominee (75.3%, a difference of 0.28%), and Yakama (75.8%, a difference of 0.35%).
| Demographics | Rating | Rank | In Labor Force | Age 20-64 |
| Blacks/African Americans | 0.0 /100 | #314 | Tragic 76.8% |
| Ottawa | 0.0 /100 | #315 | Tragic 76.7% |
| Yaqui | 0.0 /100 | #316 | Tragic 76.5% |
| Cherokee | 0.0 /100 | #317 | Tragic 76.2% |
| Chickasaw | 0.0 /100 | #318 | Tragic 76.2% |
| Inupiat | 0.0 /100 | #319 | Tragic 76.1% |
| Yakama | 0.0 /100 | #320 | Tragic 75.8% |
| Seminole | 0.0 /100 | #321 | Tragic 75.5% |
| Dutch West Indians | 0.0 /100 | #322 | Tragic 75.5% |
| Cajuns | 0.0 /100 | #323 | Tragic 75.5% |
| Choctaw | 0.0 /100 | #324 | Tragic 75.4% |
| Menominee | 0.0 /100 | #325 | Tragic 75.3% |
| Creek | 0.0 /100 | #326 | Tragic 75.1% |
| Sioux | 0.0 /100 | #327 | Tragic 75.0% |
| Kiowa | 0.0 /100 | #328 | Tragic 75.0% |
Demographics Similar to Lebanese by In Labor Force | Age 20-64
In terms of in labor force | age 20-64, the demographic groups most similar to Lebanese are Panamanian (79.1%, a difference of 0.020%), Alsatian (79.1%, a difference of 0.020%), Native Hawaiian (79.1%, a difference of 0.020%), Guamanian/Chamorro (79.1%, a difference of 0.020%), and Central American (79.1%, a difference of 0.030%).
| Demographics | Rating | Rank | In Labor Force | Age 20-64 |
| Immigrants | Uzbekistan | 6.8 /100 | #224 | Tragic 79.1% |
| Portuguese | 6.4 /100 | #225 | Tragic 79.1% |
| Central Americans | 5.9 /100 | #226 | Tragic 79.1% |
| Immigrants | Western Europe | 5.9 /100 | #227 | Tragic 79.1% |
| Panamanians | 5.7 /100 | #228 | Tragic 79.1% |
| Alsatians | 5.7 /100 | #229 | Tragic 79.1% |
| Native Hawaiians | 5.6 /100 | #230 | Tragic 79.1% |
| Lebanese | 5.1 /100 | #231 | Tragic 79.1% |
| Guamanians/Chamorros | 4.5 /100 | #232 | Tragic 79.1% |
| Japanese | 4.0 /100 | #233 | Tragic 79.1% |
| Immigrants | Canada | 3.2 /100 | #234 | Tragic 79.0% |
| Tlingit-Haida | 3.2 /100 | #235 | Tragic 79.0% |
| Samoans | 2.9 /100 | #236 | Tragic 79.0% |
| Immigrants | North America | 2.9 /100 | #237 | Tragic 79.0% |
| Immigrants | Jamaica | 2.6 /100 | #238 | Tragic 79.0% |