Immigrants from Albania vs Lebanese In Labor Force | Age 20-64
COMPARE
Immigrants from Albania
Lebanese
In Labor Force | Age 20-64
In Labor Force | Age 20-64 Comparison
Immigrants from Albania
Lebanese
80.3%
IN LABOR FORCE | AGE 20-64
98.7/ 100
METRIC RATING
64th/ 347
METRIC RANK
79.1%
IN LABOR FORCE | AGE 20-64
5.1/ 100
METRIC RATING
231st/ 347
METRIC RANK
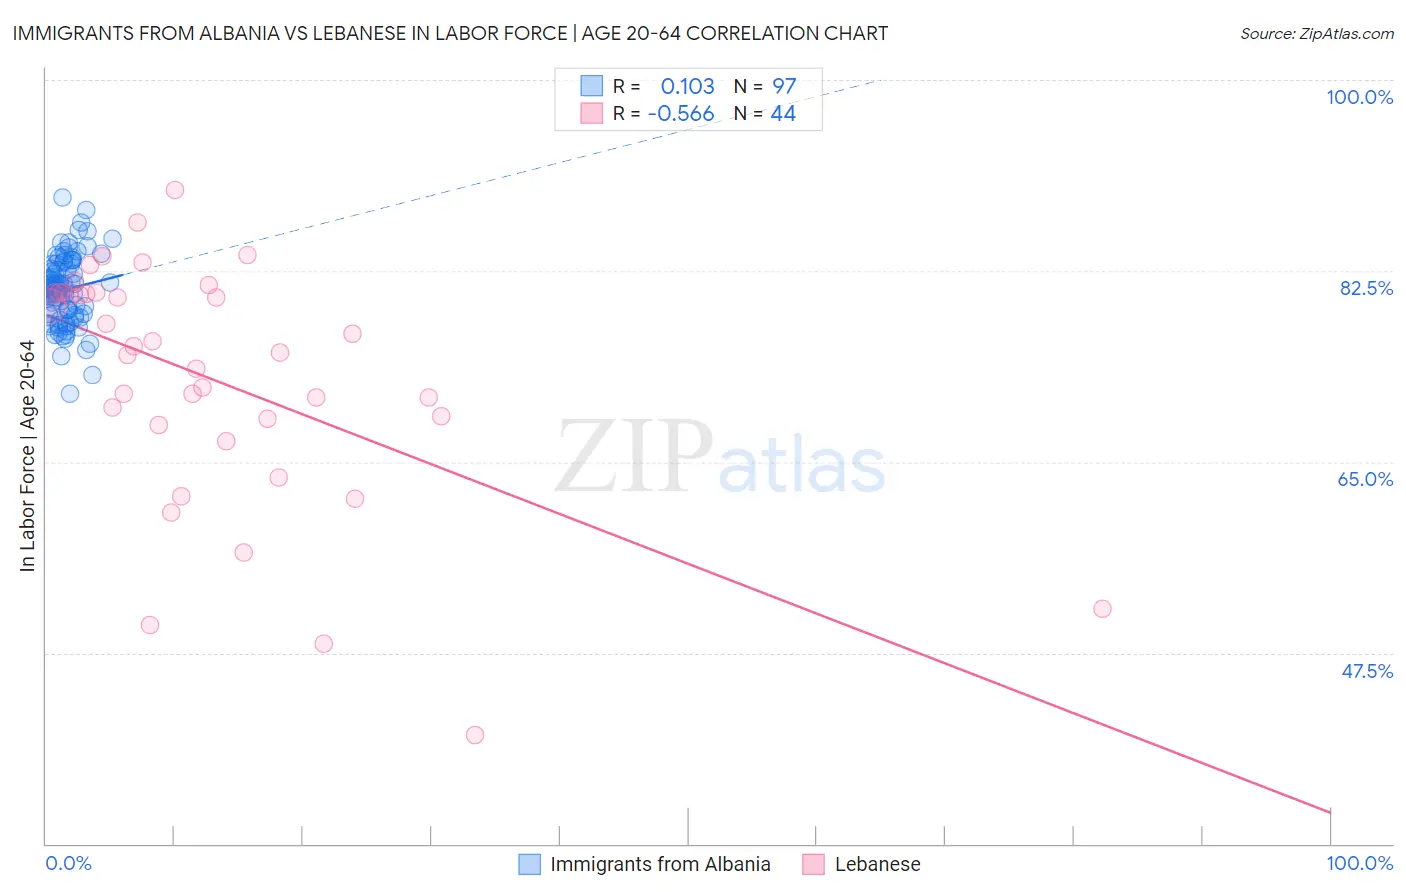
Immigrants from Albania vs Lebanese In Labor Force | Age 20-64 Correlation Chart
The statistical analysis conducted on geographies consisting of 119,398,682 people shows a poor positive correlation between the proportion of Immigrants from Albania and labor force participation rate among population between the ages 20 and 64 in the United States with a correlation coefficient (R) of 0.103 and weighted average of 80.3%. Similarly, the statistical analysis conducted on geographies consisting of 401,626,649 people shows a substantial negative correlation between the proportion of Lebanese and labor force participation rate among population between the ages 20 and 64 in the United States with a correlation coefficient (R) of -0.566 and weighted average of 79.1%, a difference of 1.5%.
In Labor Force | Age 20-64 Correlation Summary
| Measurement | Immigrants from Albania | Lebanese |
| Minimum | 71.3% | 40.0% |
| Maximum | 89.2% | 89.9% |
| Range | 17.9% | 49.9% |
| Mean | 80.8% | 72.7% |
| Median | 80.9% | 75.3% |
| Interquartile 25% (IQ1) | 78.5% | 68.6% |
| Interquartile 75% (IQ3) | 83.1% | 80.5% |
| Interquartile Range (IQR) | 4.6% | 11.9% |
| Standard Deviation (Sample) | 3.2% | 11.0% |
| Standard Deviation (Population) | 3.1% | 10.9% |
Similar Demographics by In Labor Force | Age 20-64
Demographics Similar to Immigrants from Albania by In Labor Force | Age 20-64
In terms of in labor force | age 20-64, the demographic groups most similar to Immigrants from Albania are Immigrants from Korea (80.3%, a difference of 0.0%), Carpatho Rusyn (80.3%, a difference of 0.010%), Lithuanian (80.2%, a difference of 0.010%), Macedonian (80.2%, a difference of 0.010%), and Taiwanese (80.2%, a difference of 0.010%).
| Demographics | Rating | Rank | In Labor Force | Age 20-64 |
| Afghans | 98.9 /100 | #57 | Exceptional 80.3% |
| Serbians | 98.9 /100 | #58 | Exceptional 80.3% |
| Swedes | 98.9 /100 | #59 | Exceptional 80.3% |
| Tongans | 98.8 /100 | #60 | Exceptional 80.3% |
| Burmese | 98.8 /100 | #61 | Exceptional 80.3% |
| Carpatho Rusyns | 98.8 /100 | #62 | Exceptional 80.3% |
| Immigrants | Korea | 98.8 /100 | #63 | Exceptional 80.3% |
| Immigrants | Albania | 98.7 /100 | #64 | Exceptional 80.3% |
| Lithuanians | 98.7 /100 | #65 | Exceptional 80.2% |
| Macedonians | 98.7 /100 | #66 | Exceptional 80.2% |
| Taiwanese | 98.6 /100 | #67 | Exceptional 80.2% |
| Bhutanese | 98.6 /100 | #68 | Exceptional 80.2% |
| Albanians | 98.6 /100 | #69 | Exceptional 80.2% |
| Immigrants | Turkey | 98.5 /100 | #70 | Exceptional 80.2% |
| Soviet Union | 98.5 /100 | #71 | Exceptional 80.2% |
Demographics Similar to Lebanese by In Labor Force | Age 20-64
In terms of in labor force | age 20-64, the demographic groups most similar to Lebanese are Panamanian (79.1%, a difference of 0.020%), Alsatian (79.1%, a difference of 0.020%), Native Hawaiian (79.1%, a difference of 0.020%), Guamanian/Chamorro (79.1%, a difference of 0.020%), and Central American (79.1%, a difference of 0.030%).
| Demographics | Rating | Rank | In Labor Force | Age 20-64 |
| Immigrants | Uzbekistan | 6.8 /100 | #224 | Tragic 79.1% |
| Portuguese | 6.4 /100 | #225 | Tragic 79.1% |
| Central Americans | 5.9 /100 | #226 | Tragic 79.1% |
| Immigrants | Western Europe | 5.9 /100 | #227 | Tragic 79.1% |
| Panamanians | 5.7 /100 | #228 | Tragic 79.1% |
| Alsatians | 5.7 /100 | #229 | Tragic 79.1% |
| Native Hawaiians | 5.6 /100 | #230 | Tragic 79.1% |
| Lebanese | 5.1 /100 | #231 | Tragic 79.1% |
| Guamanians/Chamorros | 4.5 /100 | #232 | Tragic 79.1% |
| Japanese | 4.0 /100 | #233 | Tragic 79.1% |
| Immigrants | Canada | 3.2 /100 | #234 | Tragic 79.0% |
| Tlingit-Haida | 3.2 /100 | #235 | Tragic 79.0% |
| Samoans | 2.9 /100 | #236 | Tragic 79.0% |
| Immigrants | North America | 2.9 /100 | #237 | Tragic 79.0% |
| Immigrants | Jamaica | 2.6 /100 | #238 | Tragic 79.0% |