Immigrants from Northern Europe vs Scandinavian In Labor Force | Age > 16
COMPARE
Immigrants from Northern Europe
Scandinavian
In Labor Force | Age > 16
In Labor Force | Age > 16 Comparison
Immigrants from Northern Europe
Scandinavians
64.7%
IN LABOR FORCE | AGE > 16
7.2/ 100
METRIC RATING
231st/ 347
METRIC RANK
65.0%
IN LABOR FORCE | AGE > 16
33.7/ 100
METRIC RATING
191st/ 347
METRIC RANK
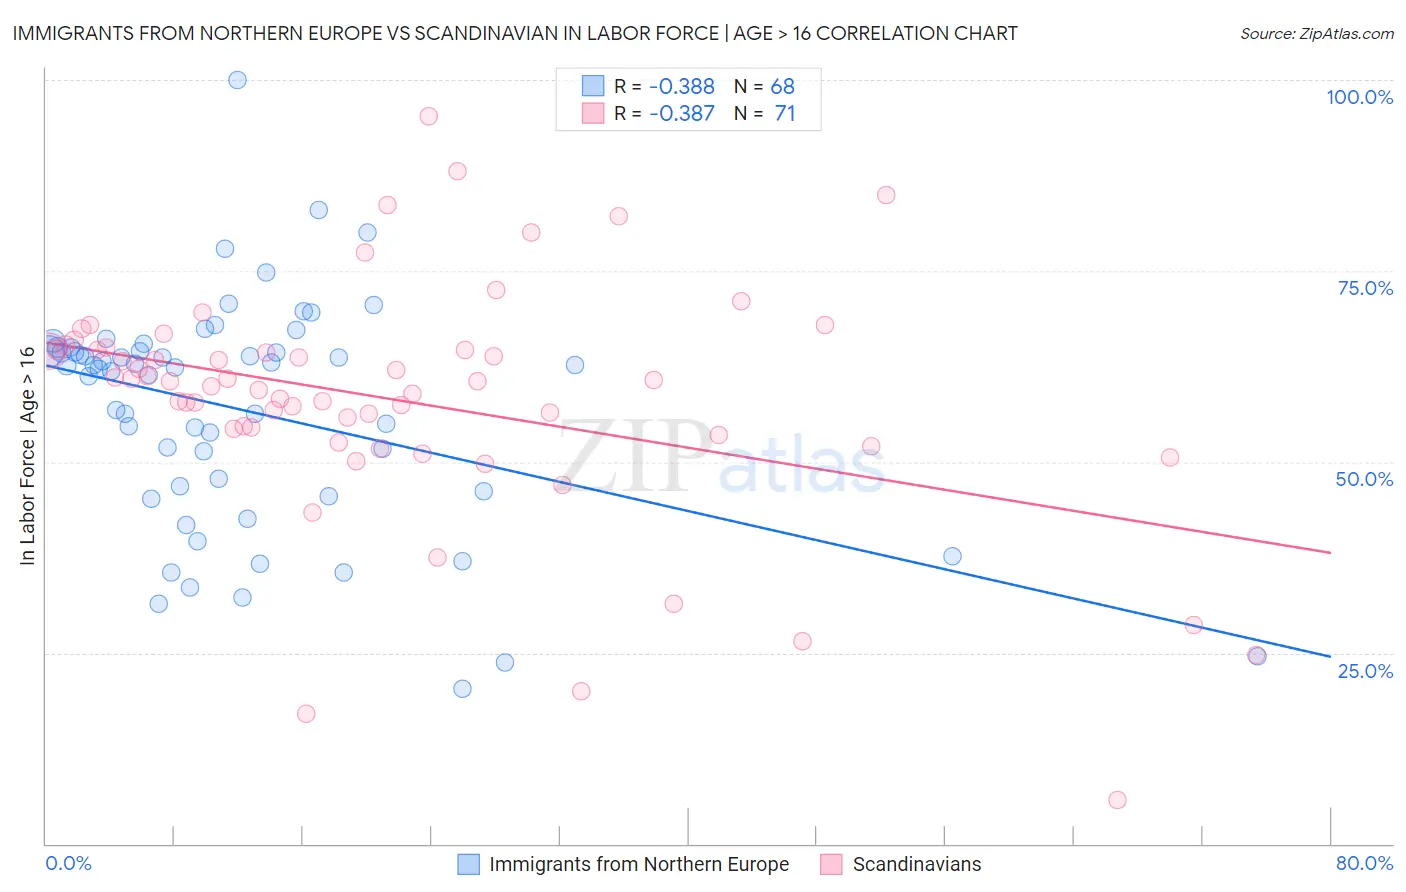
Immigrants from Northern Europe vs Scandinavian In Labor Force | Age > 16 Correlation Chart
The statistical analysis conducted on geographies consisting of 477,244,389 people shows a mild negative correlation between the proportion of Immigrants from Northern Europe and labor force participation rate among population ages 16 and over in the United States with a correlation coefficient (R) of -0.388 and weighted average of 64.7%. Similarly, the statistical analysis conducted on geographies consisting of 472,640,226 people shows a mild negative correlation between the proportion of Scandinavians and labor force participation rate among population ages 16 and over in the United States with a correlation coefficient (R) of -0.387 and weighted average of 65.0%, a difference of 0.53%.
In Labor Force | Age > 16 Correlation Summary
| Measurement | Immigrants from Northern Europe | Scandinavian |
| Minimum | 20.3% | 5.7% |
| Maximum | 100.0% | 95.2% |
| Range | 79.7% | 89.5% |
| Mean | 56.8% | 58.1% |
| Median | 62.4% | 60.5% |
| Interquartile 25% (IQ1) | 46.4% | 53.6% |
| Interquartile 75% (IQ3) | 64.7% | 64.7% |
| Interquartile Range (IQR) | 18.3% | 11.1% |
| Standard Deviation (Sample) | 14.9% | 15.7% |
| Standard Deviation (Population) | 14.8% | 15.6% |
Similar Demographics by In Labor Force | Age > 16
Demographics Similar to Immigrants from Northern Europe by In Labor Force | Age > 16
In terms of in labor force | age > 16, the demographic groups most similar to Immigrants from Northern Europe are British (64.7%, a difference of 0.0%), Chinese (64.7%, a difference of 0.0%), European (64.7%, a difference of 0.040%), Polish (64.7%, a difference of 0.040%), and Northern European (64.7%, a difference of 0.040%).
| Demographics | Rating | Rank | In Labor Force | Age > 16 |
| Immigrants | Jamaica | 8.8 /100 | #224 | Tragic 64.7% |
| Croatians | 8.8 /100 | #225 | Tragic 64.7% |
| Europeans | 8.3 /100 | #226 | Tragic 64.7% |
| Poles | 8.3 /100 | #227 | Tragic 64.7% |
| Northern Europeans | 8.2 /100 | #228 | Tragic 64.7% |
| British | 7.3 /100 | #229 | Tragic 64.7% |
| Chinese | 7.3 /100 | #230 | Tragic 64.7% |
| Immigrants | Northern Europe | 7.2 /100 | #231 | Tragic 64.7% |
| Africans | 5.8 /100 | #232 | Tragic 64.6% |
| Slavs | 4.9 /100 | #233 | Tragic 64.6% |
| Vietnamese | 4.7 /100 | #234 | Tragic 64.6% |
| Austrians | 4.6 /100 | #235 | Tragic 64.6% |
| Immigrants | Norway | 4.6 /100 | #236 | Tragic 64.6% |
| Italians | 4.6 /100 | #237 | Tragic 64.6% |
| Lebanese | 3.9 /100 | #238 | Tragic 64.5% |
Demographics Similar to Scandinavians by In Labor Force | Age > 16
In terms of in labor force | age > 16, the demographic groups most similar to Scandinavians are Barbadian (65.0%, a difference of 0.0%), Immigrants from Fiji (65.0%, a difference of 0.0%), Immigrants from Europe (65.0%, a difference of 0.0%), Immigrants from Portugal (65.0%, a difference of 0.010%), and Immigrants from Greece (65.0%, a difference of 0.010%).
| Demographics | Rating | Rank | In Labor Force | Age > 16 |
| Carpatho Rusyns | 40.0 /100 | #184 | Average 65.0% |
| Syrians | 40.0 /100 | #185 | Average 65.0% |
| Immigrants | Switzerland | 38.2 /100 | #186 | Fair 65.0% |
| Immigrants | Croatia | 35.7 /100 | #187 | Fair 65.0% |
| Immigrants | Portugal | 34.8 /100 | #188 | Fair 65.0% |
| Immigrants | Greece | 34.3 /100 | #189 | Fair 65.0% |
| Barbadians | 33.9 /100 | #190 | Fair 65.0% |
| Scandinavians | 33.7 /100 | #191 | Fair 65.0% |
| Immigrants | Fiji | 33.7 /100 | #192 | Fair 65.0% |
| Immigrants | Europe | 33.6 /100 | #193 | Fair 65.0% |
| Immigrants | Southern Europe | 31.3 /100 | #194 | Fair 65.0% |
| Romanians | 31.1 /100 | #195 | Fair 65.0% |
| Haitians | 30.6 /100 | #196 | Fair 65.0% |
| Immigrants | Italy | 28.7 /100 | #197 | Fair 65.0% |
| Greeks | 26.1 /100 | #198 | Fair 64.9% |