U.S. Virgin Islander vs Scandinavian In Labor Force | Age > 16
COMPARE
U.S. Virgin Islander
Scandinavian
In Labor Force | Age > 16
In Labor Force | Age > 16 Comparison
U.S. Virgin Islanders
Scandinavians
64.7%
IN LABOR FORCE | AGE > 16
11.3/ 100
METRIC RATING
217th/ 347
METRIC RANK
65.0%
IN LABOR FORCE | AGE > 16
33.7/ 100
METRIC RATING
191st/ 347
METRIC RANK
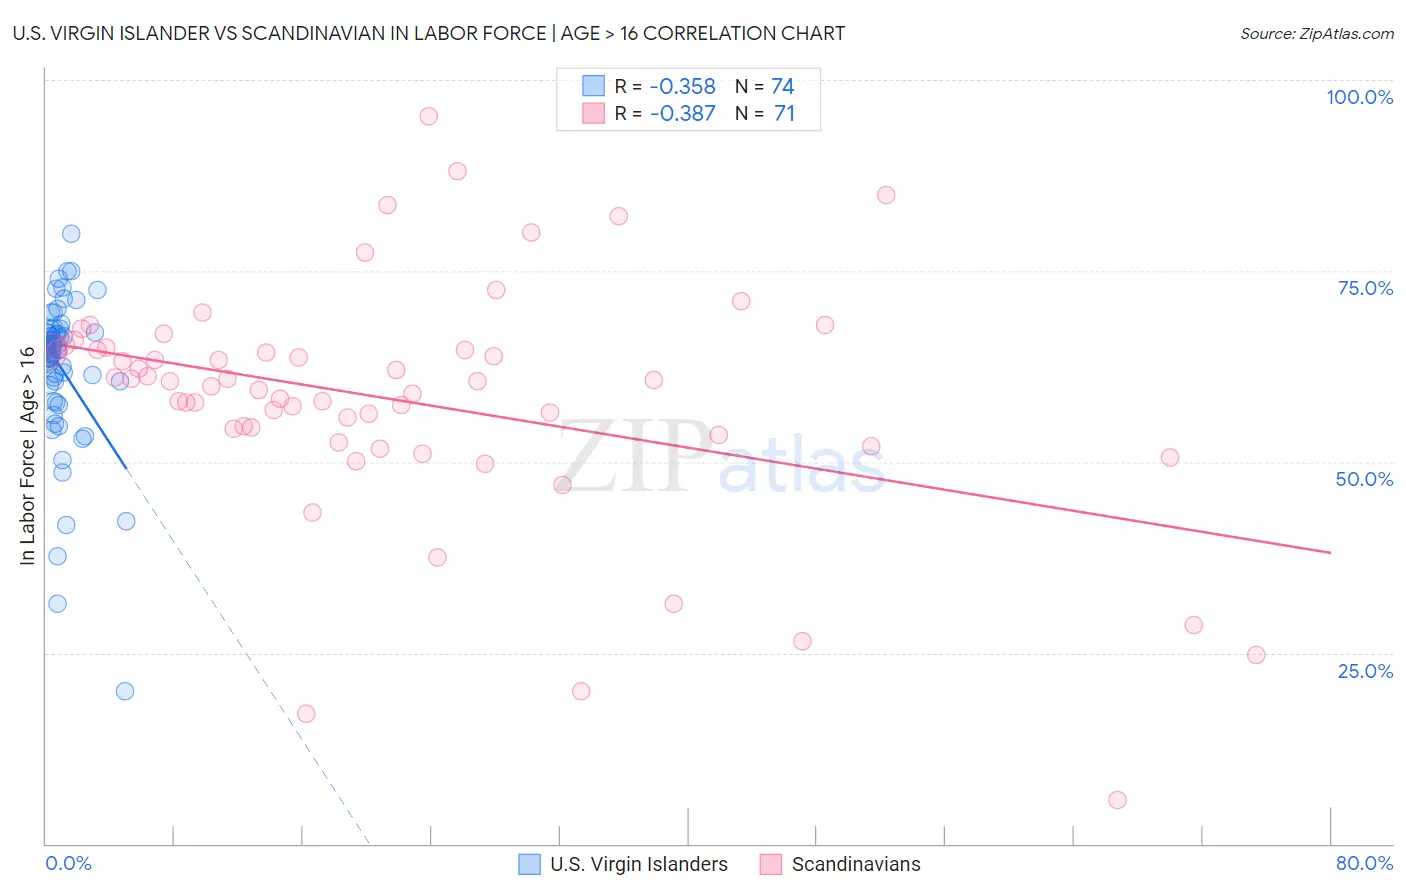
U.S. Virgin Islander vs Scandinavian In Labor Force | Age > 16 Correlation Chart
The statistical analysis conducted on geographies consisting of 87,527,161 people shows a mild negative correlation between the proportion of U.S. Virgin Islanders and labor force participation rate among population ages 16 and over in the United States with a correlation coefficient (R) of -0.358 and weighted average of 64.7%. Similarly, the statistical analysis conducted on geographies consisting of 472,640,226 people shows a mild negative correlation between the proportion of Scandinavians and labor force participation rate among population ages 16 and over in the United States with a correlation coefficient (R) of -0.387 and weighted average of 65.0%, a difference of 0.39%.
In Labor Force | Age > 16 Correlation Summary
| Measurement | U.S. Virgin Islander | Scandinavian |
| Minimum | 19.9% | 5.7% |
| Maximum | 79.8% | 95.2% |
| Range | 59.9% | 89.5% |
| Mean | 62.4% | 58.1% |
| Median | 64.8% | 60.5% |
| Interquartile 25% (IQ1) | 60.6% | 53.6% |
| Interquartile 75% (IQ3) | 66.8% | 64.7% |
| Interquartile Range (IQR) | 6.2% | 11.1% |
| Standard Deviation (Sample) | 9.7% | 15.7% |
| Standard Deviation (Population) | 9.6% | 15.6% |
Similar Demographics by In Labor Force | Age > 16
Demographics Similar to U.S. Virgin Islanders by In Labor Force | Age > 16
In terms of in labor force | age > 16, the demographic groups most similar to U.S. Virgin Islanders are Belgian (64.7%, a difference of 0.0%), Alsatian (64.7%, a difference of 0.020%), Immigrants from Central America (64.7%, a difference of 0.020%), Immigrants from Czechoslovakia (64.8%, a difference of 0.030%), and Alaska Native (64.7%, a difference of 0.040%).
| Demographics | Rating | Rank | In Labor Force | Age > 16 |
| Immigrants | Denmark | 14.7 /100 | #210 | Poor 64.8% |
| Fijians | 14.1 /100 | #211 | Poor 64.8% |
| Alaskan Athabascans | 13.9 /100 | #212 | Poor 64.8% |
| Maltese | 13.8 /100 | #213 | Poor 64.8% |
| Estonians | 13.1 /100 | #214 | Poor 64.8% |
| Immigrants | Czechoslovakia | 12.3 /100 | #215 | Poor 64.8% |
| Belgians | 11.4 /100 | #216 | Poor 64.7% |
| U.S. Virgin Islanders | 11.3 /100 | #217 | Poor 64.7% |
| Alsatians | 10.7 /100 | #218 | Poor 64.7% |
| Immigrants | Central America | 10.5 /100 | #219 | Poor 64.7% |
| Alaska Natives | 9.9 /100 | #220 | Tragic 64.7% |
| Immigrants | Micronesia | 9.6 /100 | #221 | Tragic 64.7% |
| Hawaiians | 9.3 /100 | #222 | Tragic 64.7% |
| Immigrants | Belize | 9.2 /100 | #223 | Tragic 64.7% |
| Immigrants | Jamaica | 8.8 /100 | #224 | Tragic 64.7% |
Demographics Similar to Scandinavians by In Labor Force | Age > 16
In terms of in labor force | age > 16, the demographic groups most similar to Scandinavians are Barbadian (65.0%, a difference of 0.0%), Immigrants from Fiji (65.0%, a difference of 0.0%), Immigrants from Europe (65.0%, a difference of 0.0%), Immigrants from Portugal (65.0%, a difference of 0.010%), and Immigrants from Greece (65.0%, a difference of 0.010%).
| Demographics | Rating | Rank | In Labor Force | Age > 16 |
| Carpatho Rusyns | 40.0 /100 | #184 | Average 65.0% |
| Syrians | 40.0 /100 | #185 | Average 65.0% |
| Immigrants | Switzerland | 38.2 /100 | #186 | Fair 65.0% |
| Immigrants | Croatia | 35.7 /100 | #187 | Fair 65.0% |
| Immigrants | Portugal | 34.8 /100 | #188 | Fair 65.0% |
| Immigrants | Greece | 34.3 /100 | #189 | Fair 65.0% |
| Barbadians | 33.9 /100 | #190 | Fair 65.0% |
| Scandinavians | 33.7 /100 | #191 | Fair 65.0% |
| Immigrants | Fiji | 33.7 /100 | #192 | Fair 65.0% |
| Immigrants | Europe | 33.6 /100 | #193 | Fair 65.0% |
| Immigrants | Southern Europe | 31.3 /100 | #194 | Fair 65.0% |
| Romanians | 31.1 /100 | #195 | Fair 65.0% |
| Haitians | 30.6 /100 | #196 | Fair 65.0% |
| Immigrants | Italy | 28.7 /100 | #197 | Fair 65.0% |
| Greeks | 26.1 /100 | #198 | Fair 64.9% |