Ethiopian vs Scandinavian In Labor Force | Age > 16
COMPARE
Ethiopian
Scandinavian
In Labor Force | Age > 16
In Labor Force | Age > 16 Comparison
Ethiopians
Scandinavians
69.3%
IN LABOR FORCE | AGE > 16
100.0/ 100
METRIC RATING
2nd/ 347
METRIC RANK
65.0%
IN LABOR FORCE | AGE > 16
33.7/ 100
METRIC RATING
191st/ 347
METRIC RANK
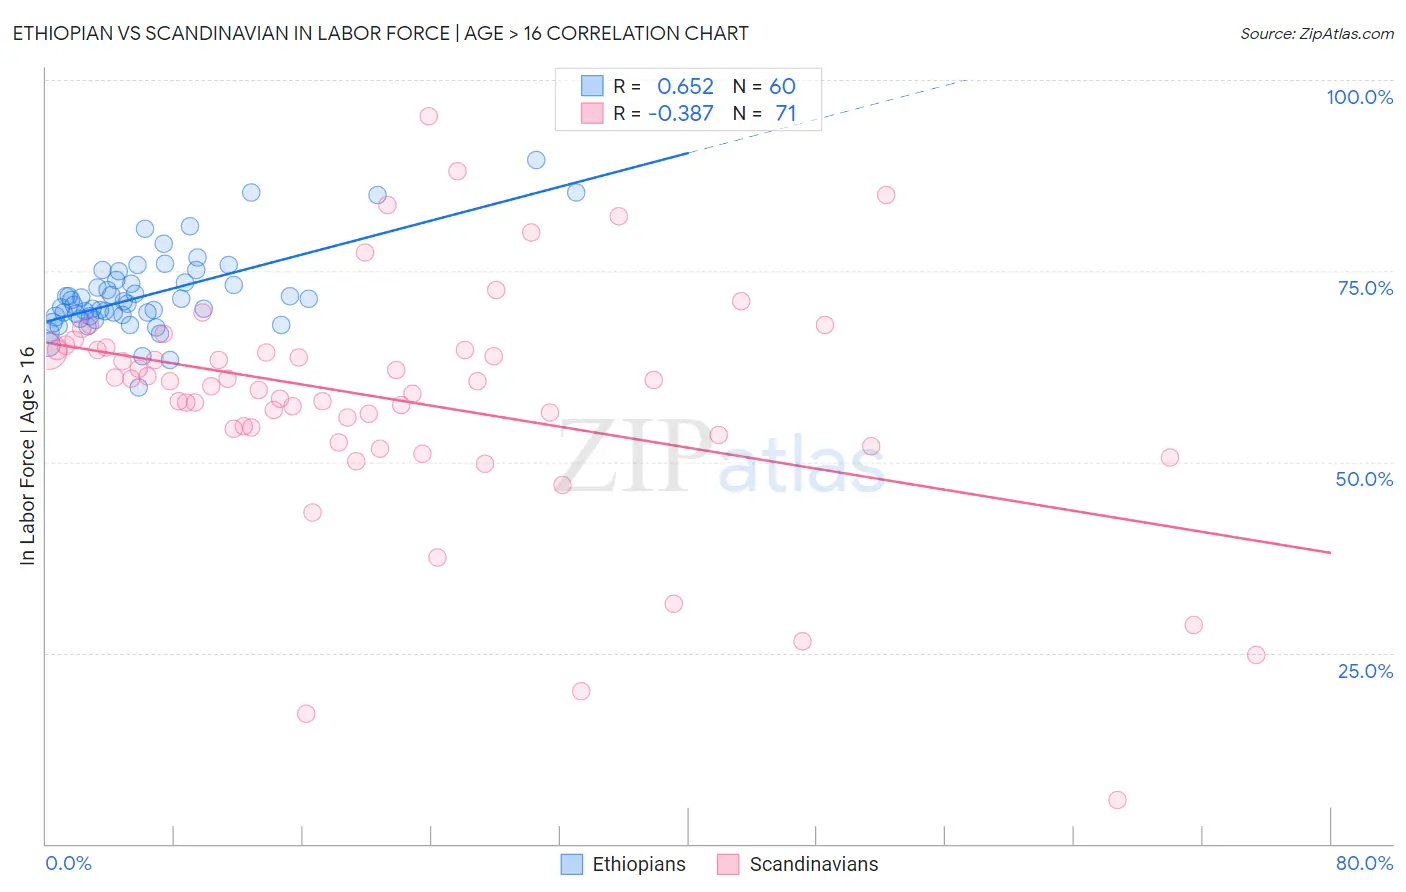
Ethiopian vs Scandinavian In Labor Force | Age > 16 Correlation Chart
The statistical analysis conducted on geographies consisting of 223,268,503 people shows a significant positive correlation between the proportion of Ethiopians and labor force participation rate among population ages 16 and over in the United States with a correlation coefficient (R) of 0.652 and weighted average of 69.3%. Similarly, the statistical analysis conducted on geographies consisting of 472,640,226 people shows a mild negative correlation between the proportion of Scandinavians and labor force participation rate among population ages 16 and over in the United States with a correlation coefficient (R) of -0.387 and weighted average of 65.0%, a difference of 6.6%.
In Labor Force | Age > 16 Correlation Summary
| Measurement | Ethiopian | Scandinavian |
| Minimum | 59.7% | 5.7% |
| Maximum | 89.5% | 95.2% |
| Range | 29.8% | 89.5% |
| Mean | 71.9% | 58.1% |
| Median | 70.8% | 60.5% |
| Interquartile 25% (IQ1) | 69.0% | 53.6% |
| Interquartile 75% (IQ3) | 73.6% | 64.7% |
| Interquartile Range (IQR) | 4.6% | 11.1% |
| Standard Deviation (Sample) | 5.4% | 15.7% |
| Standard Deviation (Population) | 5.4% | 15.6% |
Similar Demographics by In Labor Force | Age > 16
Demographics Similar to Ethiopians by In Labor Force | Age > 16
In terms of in labor force | age > 16, the demographic groups most similar to Ethiopians are Immigrants from Ethiopia (69.4%, a difference of 0.16%), Somali (69.2%, a difference of 0.20%), Immigrants from Somalia (69.1%, a difference of 0.27%), Sierra Leonean (68.9%, a difference of 0.58%), and Immigrants from Eritrea (68.9%, a difference of 0.63%).
| Demographics | Rating | Rank | In Labor Force | Age > 16 |
| Immigrants | Ethiopia | 100.0 /100 | #1 | Exceptional 69.4% |
| Ethiopians | 100.0 /100 | #2 | Exceptional 69.3% |
| Somalis | 100.0 /100 | #3 | Exceptional 69.2% |
| Immigrants | Somalia | 100.0 /100 | #4 | Exceptional 69.1% |
| Sierra Leoneans | 100.0 /100 | #5 | Exceptional 68.9% |
| Immigrants | Eritrea | 100.0 /100 | #6 | Exceptional 68.9% |
| Immigrants | Cameroon | 100.0 /100 | #7 | Exceptional 68.7% |
| Immigrants | Sierra Leone | 100.0 /100 | #8 | Exceptional 68.5% |
| Immigrants | Eastern Africa | 100.0 /100 | #9 | Exceptional 68.5% |
| Immigrants | Bolivia | 100.0 /100 | #10 | Exceptional 68.4% |
| Bolivians | 100.0 /100 | #11 | Exceptional 68.2% |
| Sudanese | 100.0 /100 | #12 | Exceptional 68.0% |
| Immigrants | Nepal | 100.0 /100 | #13 | Exceptional 68.0% |
| Liberians | 100.0 /100 | #14 | Exceptional 67.8% |
| Immigrants | Middle Africa | 100.0 /100 | #15 | Exceptional 67.7% |
Demographics Similar to Scandinavians by In Labor Force | Age > 16
In terms of in labor force | age > 16, the demographic groups most similar to Scandinavians are Barbadian (65.0%, a difference of 0.0%), Immigrants from Fiji (65.0%, a difference of 0.0%), Immigrants from Europe (65.0%, a difference of 0.0%), Immigrants from Portugal (65.0%, a difference of 0.010%), and Immigrants from Greece (65.0%, a difference of 0.010%).
| Demographics | Rating | Rank | In Labor Force | Age > 16 |
| Carpatho Rusyns | 40.0 /100 | #184 | Average 65.0% |
| Syrians | 40.0 /100 | #185 | Average 65.0% |
| Immigrants | Switzerland | 38.2 /100 | #186 | Fair 65.0% |
| Immigrants | Croatia | 35.7 /100 | #187 | Fair 65.0% |
| Immigrants | Portugal | 34.8 /100 | #188 | Fair 65.0% |
| Immigrants | Greece | 34.3 /100 | #189 | Fair 65.0% |
| Barbadians | 33.9 /100 | #190 | Fair 65.0% |
| Scandinavians | 33.7 /100 | #191 | Fair 65.0% |
| Immigrants | Fiji | 33.7 /100 | #192 | Fair 65.0% |
| Immigrants | Europe | 33.6 /100 | #193 | Fair 65.0% |
| Immigrants | Southern Europe | 31.3 /100 | #194 | Fair 65.0% |
| Romanians | 31.1 /100 | #195 | Fair 65.0% |
| Haitians | 30.6 /100 | #196 | Fair 65.0% |
| Immigrants | Italy | 28.7 /100 | #197 | Fair 65.0% |
| Greeks | 26.1 /100 | #198 | Fair 64.9% |