Immigrants from Peru vs Argentinean In Labor Force | Age 30-34
COMPARE
Immigrants from Peru
Argentinean
In Labor Force | Age 30-34
In Labor Force | Age 30-34 Comparison
Immigrants from Peru
Argentineans
84.7%
IN LABOR FORCE | AGE 30-34
52.4/ 100
METRIC RATING
168th/ 347
METRIC RANK
85.1%
IN LABOR FORCE | AGE 30-34
95.8/ 100
METRIC RATING
109th/ 347
METRIC RANK
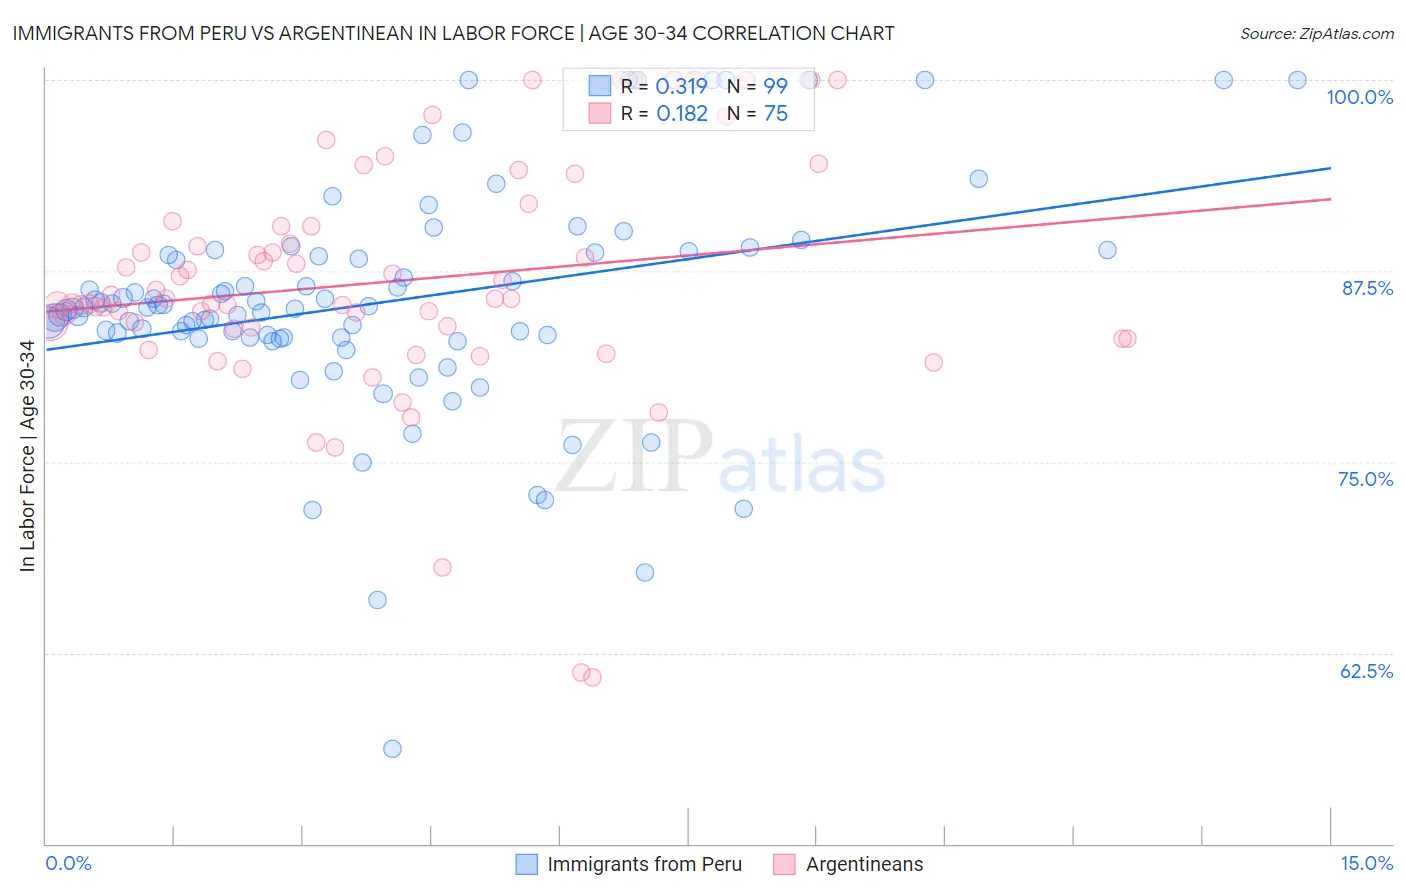
Immigrants from Peru vs Argentinean In Labor Force | Age 30-34 Correlation Chart
The statistical analysis conducted on geographies consisting of 328,740,513 people shows a mild positive correlation between the proportion of Immigrants from Peru and labor force participation rate among population between the ages 30 and 34 in the United States with a correlation coefficient (R) of 0.319 and weighted average of 84.7%. Similarly, the statistical analysis conducted on geographies consisting of 297,011,031 people shows a poor positive correlation between the proportion of Argentineans and labor force participation rate among population between the ages 30 and 34 in the United States with a correlation coefficient (R) of 0.182 and weighted average of 85.1%, a difference of 0.53%.
In Labor Force | Age 30-34 Correlation Summary
| Measurement | Immigrants from Peru | Argentinean |
| Minimum | 56.2% | 60.9% |
| Maximum | 100.0% | 100.0% |
| Range | 43.8% | 39.1% |
| Mean | 85.4% | 86.8% |
| Median | 85.1% | 85.7% |
| Interquartile 25% (IQ1) | 83.1% | 83.7% |
| Interquartile 75% (IQ3) | 88.7% | 90.4% |
| Interquartile Range (IQR) | 5.6% | 6.7% |
| Standard Deviation (Sample) | 7.5% | 7.8% |
| Standard Deviation (Population) | 7.4% | 7.8% |
Similar Demographics by In Labor Force | Age 30-34
Demographics Similar to Immigrants from Peru by In Labor Force | Age 30-34
In terms of in labor force | age 30-34, the demographic groups most similar to Immigrants from Peru are South American Indian (84.7%, a difference of 0.0%), Immigrants from Burma/Myanmar (84.7%, a difference of 0.0%), Irish (84.7%, a difference of 0.0%), Immigrants from England (84.7%, a difference of 0.0%), and Immigrants from South Eastern Asia (84.7%, a difference of 0.010%).
| Demographics | Rating | Rank | In Labor Force | Age 30-34 |
| Immigrants | Cambodia | 60.7 /100 | #161 | Good 84.7% |
| South Americans | 58.7 /100 | #162 | Average 84.7% |
| Immigrants | Uruguay | 57.4 /100 | #163 | Average 84.7% |
| Icelanders | 56.8 /100 | #164 | Average 84.7% |
| Immigrants | Western Europe | 56.7 /100 | #165 | Average 84.7% |
| Afghans | 55.2 /100 | #166 | Average 84.7% |
| Immigrants | South Eastern Asia | 54.2 /100 | #167 | Average 84.7% |
| Immigrants | Peru | 52.4 /100 | #168 | Average 84.7% |
| South American Indians | 52.1 /100 | #169 | Average 84.7% |
| Immigrants | Burma/Myanmar | 52.0 /100 | #170 | Average 84.7% |
| Irish | 52.0 /100 | #171 | Average 84.7% |
| Immigrants | England | 51.7 /100 | #172 | Average 84.7% |
| Israelis | 51.1 /100 | #173 | Average 84.7% |
| Finns | 50.0 /100 | #174 | Average 84.7% |
| Immigrants | South America | 50.0 /100 | #175 | Average 84.7% |
Demographics Similar to Argentineans by In Labor Force | Age 30-34
In terms of in labor force | age 30-34, the demographic groups most similar to Argentineans are Immigrants from Zimbabwe (85.1%, a difference of 0.0%), Immigrants from Northern Africa (85.2%, a difference of 0.020%), Immigrants from South Africa (85.1%, a difference of 0.020%), Alsatian (85.2%, a difference of 0.030%), and Immigrants from Middle Africa (85.2%, a difference of 0.030%).
| Demographics | Rating | Rank | In Labor Force | Age 30-34 |
| Immigrants | Austria | 96.8 /100 | #102 | Exceptional 85.2% |
| Ukrainians | 96.6 /100 | #103 | Exceptional 85.2% |
| Immigrants | Ghana | 96.5 /100 | #104 | Exceptional 85.2% |
| Alsatians | 96.3 /100 | #105 | Exceptional 85.2% |
| Immigrants | Middle Africa | 96.3 /100 | #106 | Exceptional 85.2% |
| Immigrants | Northern Africa | 96.3 /100 | #107 | Exceptional 85.2% |
| Immigrants | Zimbabwe | 95.8 /100 | #108 | Exceptional 85.1% |
| Argentineans | 95.8 /100 | #109 | Exceptional 85.1% |
| Immigrants | South Africa | 95.3 /100 | #110 | Exceptional 85.1% |
| Immigrants | Scotland | 94.9 /100 | #111 | Exceptional 85.1% |
| Immigrants | Hungary | 94.8 /100 | #112 | Exceptional 85.1% |
| Immigrants | Romania | 94.7 /100 | #113 | Exceptional 85.1% |
| Yugoslavians | 94.7 /100 | #114 | Exceptional 85.1% |
| Immigrants | South Central Asia | 94.6 /100 | #115 | Exceptional 85.1% |
| Egyptians | 94.5 /100 | #116 | Exceptional 85.1% |