Immigrants from Peru vs Immigrants from Cuba In Labor Force | Age 30-34
COMPARE
Immigrants from Peru
Immigrants from Cuba
In Labor Force | Age 30-34
In Labor Force | Age 30-34 Comparison
Immigrants from Peru
Immigrants from Cuba
84.7%
IN LABOR FORCE | AGE 30-34
52.4/ 100
METRIC RATING
168th/ 347
METRIC RANK
84.2%
IN LABOR FORCE | AGE 30-34
3.0/ 100
METRIC RATING
227th/ 347
METRIC RANK
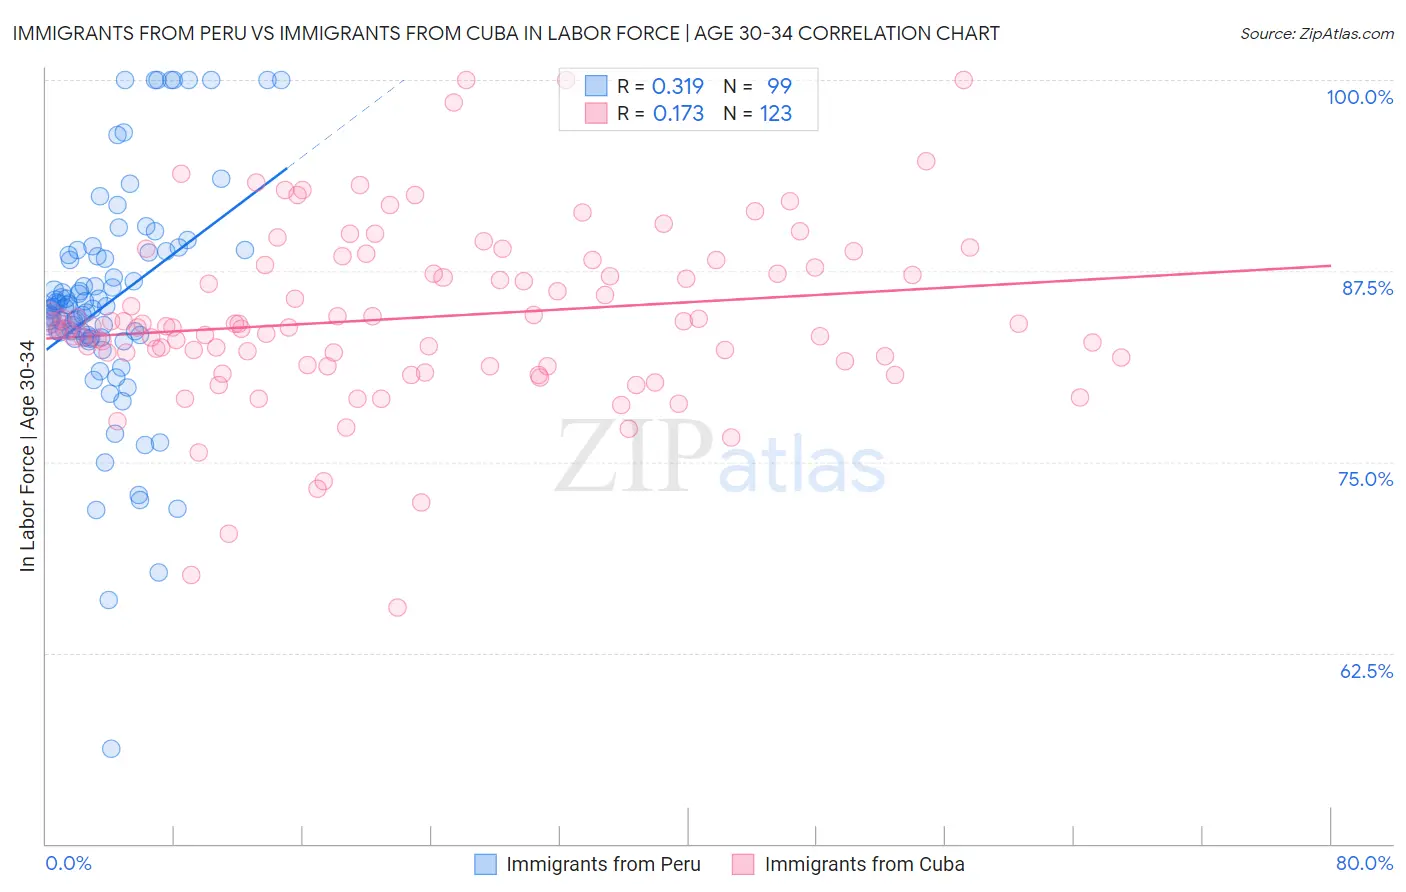
Immigrants from Peru vs Immigrants from Cuba In Labor Force | Age 30-34 Correlation Chart
The statistical analysis conducted on geographies consisting of 328,740,513 people shows a mild positive correlation between the proportion of Immigrants from Peru and labor force participation rate among population between the ages 30 and 34 in the United States with a correlation coefficient (R) of 0.319 and weighted average of 84.7%. Similarly, the statistical analysis conducted on geographies consisting of 325,881,982 people shows a poor positive correlation between the proportion of Immigrants from Cuba and labor force participation rate among population between the ages 30 and 34 in the United States with a correlation coefficient (R) of 0.173 and weighted average of 84.2%, a difference of 0.63%.
In Labor Force | Age 30-34 Correlation Summary
| Measurement | Immigrants from Peru | Immigrants from Cuba |
| Minimum | 56.2% | 65.5% |
| Maximum | 100.0% | 100.0% |
| Range | 43.8% | 34.5% |
| Mean | 85.4% | 84.5% |
| Median | 85.1% | 83.9% |
| Interquartile 25% (IQ1) | 83.1% | 81.4% |
| Interquartile 75% (IQ3) | 88.7% | 87.9% |
| Interquartile Range (IQR) | 5.6% | 6.5% |
| Standard Deviation (Sample) | 7.5% | 5.8% |
| Standard Deviation (Population) | 7.4% | 5.8% |
Similar Demographics by In Labor Force | Age 30-34
Demographics Similar to Immigrants from Peru by In Labor Force | Age 30-34
In terms of in labor force | age 30-34, the demographic groups most similar to Immigrants from Peru are South American Indian (84.7%, a difference of 0.0%), Immigrants from Burma/Myanmar (84.7%, a difference of 0.0%), Irish (84.7%, a difference of 0.0%), Immigrants from England (84.7%, a difference of 0.0%), and Immigrants from South Eastern Asia (84.7%, a difference of 0.010%).
| Demographics | Rating | Rank | In Labor Force | Age 30-34 |
| Immigrants | Cambodia | 60.7 /100 | #161 | Good 84.7% |
| South Americans | 58.7 /100 | #162 | Average 84.7% |
| Immigrants | Uruguay | 57.4 /100 | #163 | Average 84.7% |
| Icelanders | 56.8 /100 | #164 | Average 84.7% |
| Immigrants | Western Europe | 56.7 /100 | #165 | Average 84.7% |
| Afghans | 55.2 /100 | #166 | Average 84.7% |
| Immigrants | South Eastern Asia | 54.2 /100 | #167 | Average 84.7% |
| Immigrants | Peru | 52.4 /100 | #168 | Average 84.7% |
| South American Indians | 52.1 /100 | #169 | Average 84.7% |
| Immigrants | Burma/Myanmar | 52.0 /100 | #170 | Average 84.7% |
| Irish | 52.0 /100 | #171 | Average 84.7% |
| Immigrants | England | 51.7 /100 | #172 | Average 84.7% |
| Israelis | 51.1 /100 | #173 | Average 84.7% |
| Finns | 50.0 /100 | #174 | Average 84.7% |
| Immigrants | South America | 50.0 /100 | #175 | Average 84.7% |
Demographics Similar to Immigrants from Cuba by In Labor Force | Age 30-34
In terms of in labor force | age 30-34, the demographic groups most similar to Immigrants from Cuba are Immigrants from El Salvador (84.2%, a difference of 0.0%), Scottish (84.2%, a difference of 0.010%), Immigrants from Haiti (84.2%, a difference of 0.010%), Welsh (84.2%, a difference of 0.010%), and Cuban (84.2%, a difference of 0.020%).
| Demographics | Rating | Rank | In Labor Force | Age 30-34 |
| Danes | 5.3 /100 | #220 | Tragic 84.3% |
| Salvadorans | 3.8 /100 | #221 | Tragic 84.2% |
| Panamanians | 3.8 /100 | #222 | Tragic 84.2% |
| Immigrants | Laos | 3.6 /100 | #223 | Tragic 84.2% |
| Cubans | 3.4 /100 | #224 | Tragic 84.2% |
| Scottish | 3.1 /100 | #225 | Tragic 84.2% |
| Immigrants | El Salvador | 3.0 /100 | #226 | Tragic 84.2% |
| Immigrants | Cuba | 3.0 /100 | #227 | Tragic 84.2% |
| Immigrants | Haiti | 2.8 /100 | #228 | Tragic 84.2% |
| Welsh | 2.7 /100 | #229 | Tragic 84.2% |
| Immigrants | Bahamas | 2.6 /100 | #230 | Tragic 84.1% |
| Malaysians | 2.2 /100 | #231 | Tragic 84.1% |
| Immigrants | Immigrants | 2.0 /100 | #232 | Tragic 84.1% |
| West Indians | 1.9 /100 | #233 | Tragic 84.1% |
| Haitians | 1.8 /100 | #234 | Tragic 84.1% |