Immigrants from Peru vs Scotch-Irish In Labor Force | Age 30-34
COMPARE
Immigrants from Peru
Scotch-Irish
In Labor Force | Age 30-34
In Labor Force | Age 30-34 Comparison
Immigrants from Peru
Scotch-Irish
84.7%
IN LABOR FORCE | AGE 30-34
52.4/ 100
METRIC RATING
168th/ 347
METRIC RANK
83.8%
IN LABOR FORCE | AGE 30-34
0.3/ 100
METRIC RATING
259th/ 347
METRIC RANK
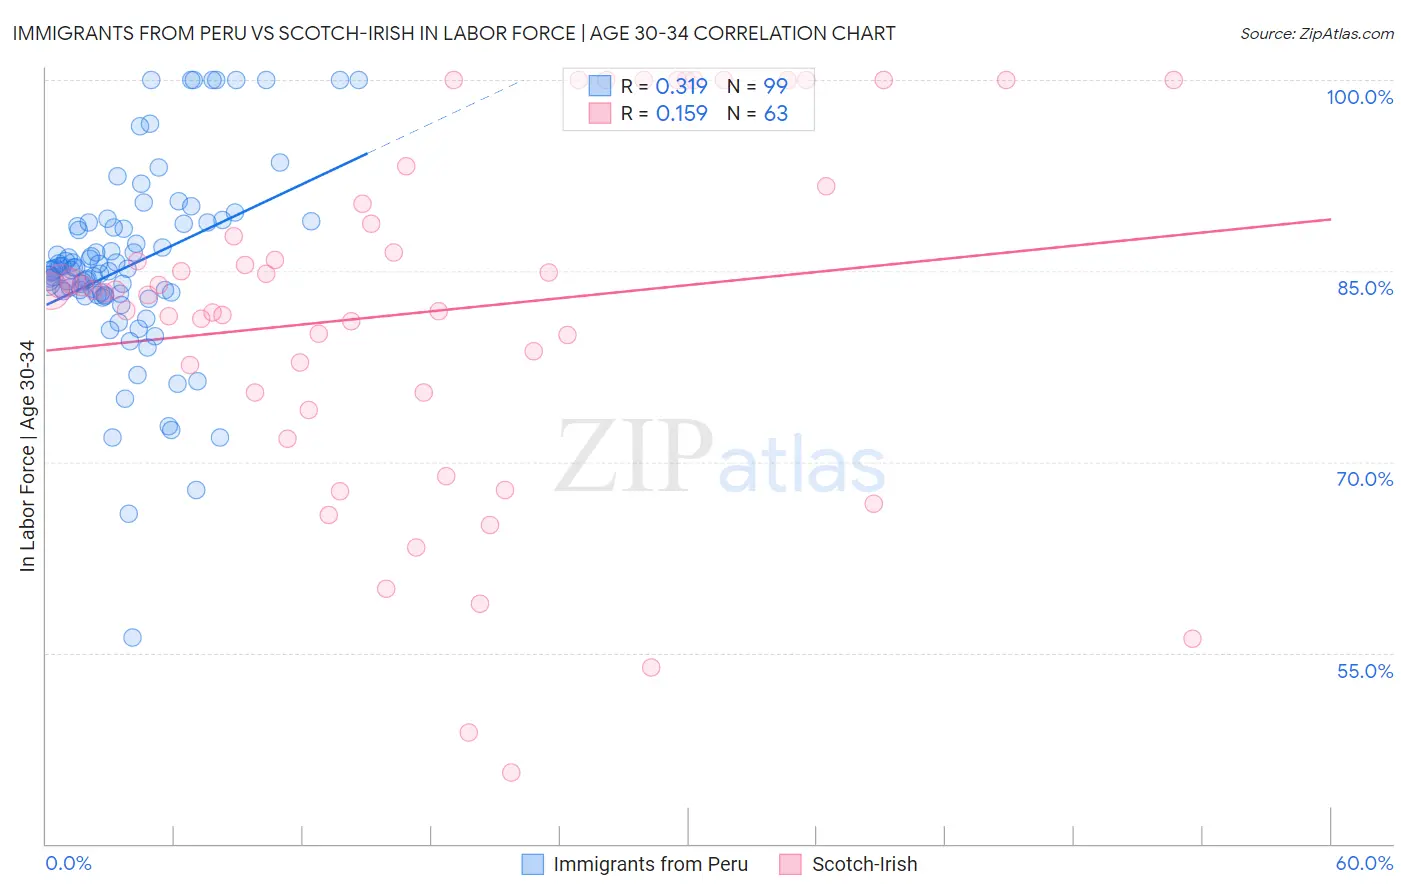
Immigrants from Peru vs Scotch-Irish In Labor Force | Age 30-34 Correlation Chart
The statistical analysis conducted on geographies consisting of 328,740,513 people shows a mild positive correlation between the proportion of Immigrants from Peru and labor force participation rate among population between the ages 30 and 34 in the United States with a correlation coefficient (R) of 0.319 and weighted average of 84.7%. Similarly, the statistical analysis conducted on geographies consisting of 547,840,713 people shows a poor positive correlation between the proportion of Scotch-Irish and labor force participation rate among population between the ages 30 and 34 in the United States with a correlation coefficient (R) of 0.159 and weighted average of 83.8%, a difference of 1.1%.
In Labor Force | Age 30-34 Correlation Summary
| Measurement | Immigrants from Peru | Scotch-Irish |
| Minimum | 56.2% | 45.6% |
| Maximum | 100.0% | 100.0% |
| Range | 43.8% | 54.4% |
| Mean | 85.4% | 81.8% |
| Median | 85.1% | 83.4% |
| Interquartile 25% (IQ1) | 83.1% | 75.4% |
| Interquartile 75% (IQ3) | 88.7% | 90.3% |
| Interquartile Range (IQR) | 5.6% | 14.8% |
| Standard Deviation (Sample) | 7.5% | 13.7% |
| Standard Deviation (Population) | 7.4% | 13.6% |
Similar Demographics by In Labor Force | Age 30-34
Demographics Similar to Immigrants from Peru by In Labor Force | Age 30-34
In terms of in labor force | age 30-34, the demographic groups most similar to Immigrants from Peru are South American Indian (84.7%, a difference of 0.0%), Immigrants from Burma/Myanmar (84.7%, a difference of 0.0%), Irish (84.7%, a difference of 0.0%), Immigrants from England (84.7%, a difference of 0.0%), and Immigrants from South Eastern Asia (84.7%, a difference of 0.010%).
| Demographics | Rating | Rank | In Labor Force | Age 30-34 |
| Immigrants | Cambodia | 60.7 /100 | #161 | Good 84.7% |
| South Americans | 58.7 /100 | #162 | Average 84.7% |
| Immigrants | Uruguay | 57.4 /100 | #163 | Average 84.7% |
| Icelanders | 56.8 /100 | #164 | Average 84.7% |
| Immigrants | Western Europe | 56.7 /100 | #165 | Average 84.7% |
| Afghans | 55.2 /100 | #166 | Average 84.7% |
| Immigrants | South Eastern Asia | 54.2 /100 | #167 | Average 84.7% |
| Immigrants | Peru | 52.4 /100 | #168 | Average 84.7% |
| South American Indians | 52.1 /100 | #169 | Average 84.7% |
| Immigrants | Burma/Myanmar | 52.0 /100 | #170 | Average 84.7% |
| Irish | 52.0 /100 | #171 | Average 84.7% |
| Immigrants | England | 51.7 /100 | #172 | Average 84.7% |
| Israelis | 51.1 /100 | #173 | Average 84.7% |
| Finns | 50.0 /100 | #174 | Average 84.7% |
| Immigrants | South America | 50.0 /100 | #175 | Average 84.7% |
Demographics Similar to Scotch-Irish by In Labor Force | Age 30-34
In terms of in labor force | age 30-34, the demographic groups most similar to Scotch-Irish are Honduran (83.8%, a difference of 0.0%), Immigrants from Dominican Republic (83.8%, a difference of 0.020%), Guyanese (83.8%, a difference of 0.020%), Iraqi (83.8%, a difference of 0.030%), and Dominican (83.8%, a difference of 0.040%).
| Demographics | Rating | Rank | In Labor Force | Age 30-34 |
| Bahamians | 0.6 /100 | #252 | Tragic 83.9% |
| Immigrants | Nicaragua | 0.6 /100 | #253 | Tragic 83.9% |
| Immigrants | St. Vincent and the Grenadines | 0.5 /100 | #254 | Tragic 83.9% |
| Whites/Caucasians | 0.5 /100 | #255 | Tragic 83.9% |
| Immigrants | Lebanon | 0.4 /100 | #256 | Tragic 83.9% |
| Iraqis | 0.3 /100 | #257 | Tragic 83.8% |
| Hondurans | 0.3 /100 | #258 | Tragic 83.8% |
| Scotch-Irish | 0.3 /100 | #259 | Tragic 83.8% |
| Immigrants | Dominican Republic | 0.3 /100 | #260 | Tragic 83.8% |
| Guyanese | 0.3 /100 | #261 | Tragic 83.8% |
| Dominicans | 0.2 /100 | #262 | Tragic 83.8% |
| Immigrants | Guyana | 0.2 /100 | #263 | Tragic 83.8% |
| Guatemalans | 0.2 /100 | #264 | Tragic 83.7% |
| Immigrants | Honduras | 0.1 /100 | #265 | Tragic 83.7% |
| Immigrants | Guatemala | 0.1 /100 | #266 | Tragic 83.7% |