French vs Creek In Labor Force | Age 30-34
COMPARE
French
Creek
In Labor Force | Age 30-34
In Labor Force | Age 30-34 Comparison
French
Creek
84.4%
IN LABOR FORCE | AGE 30-34
13.8/ 100
METRIC RATING
205th/ 347
METRIC RANK
80.4%
IN LABOR FORCE | AGE 30-34
0.0/ 100
METRIC RATING
329th/ 347
METRIC RANK
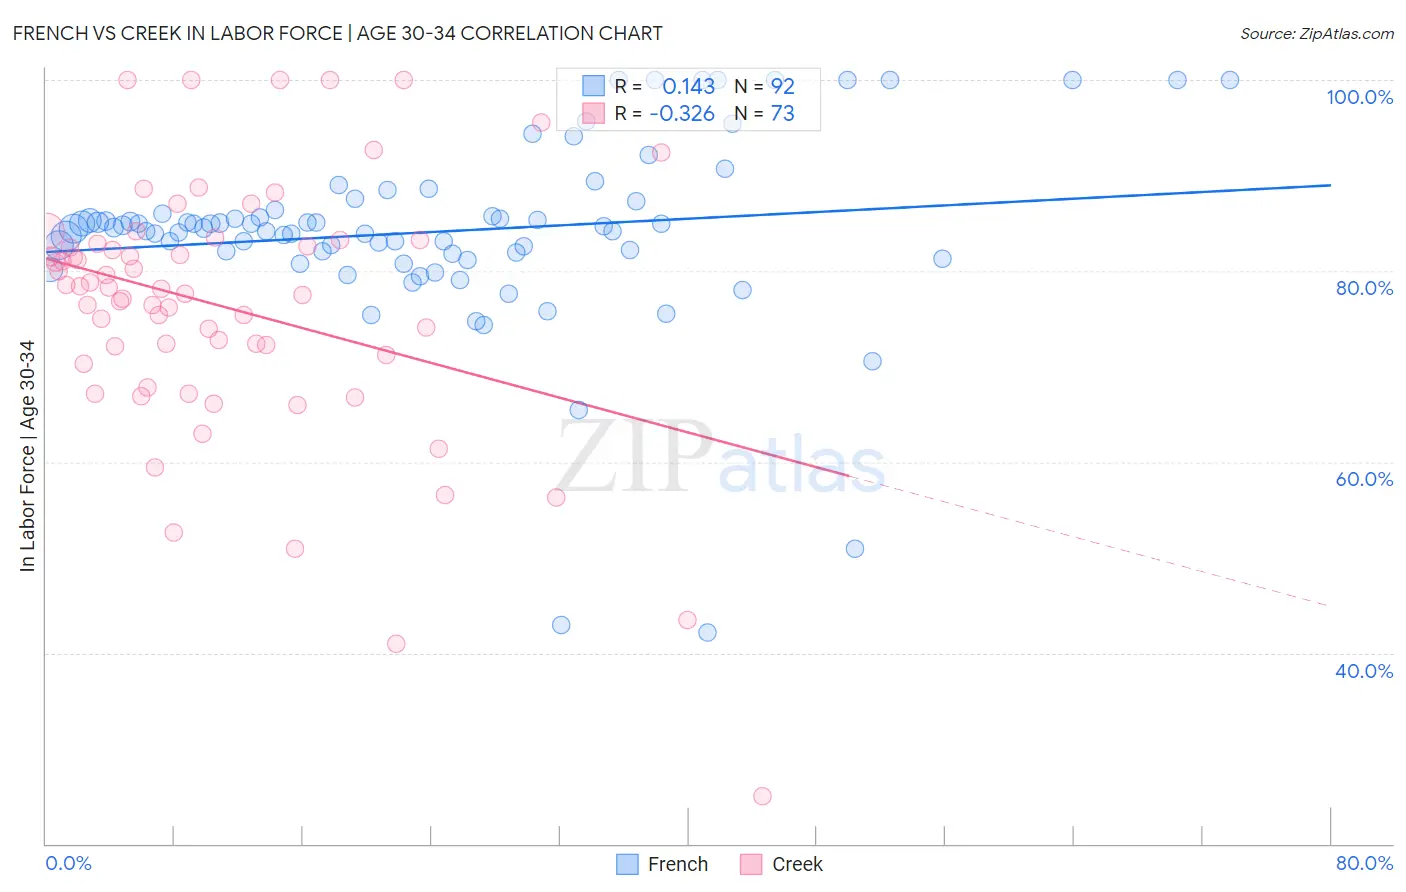
French vs Creek In Labor Force | Age 30-34 Correlation Chart
The statistical analysis conducted on geographies consisting of 571,091,805 people shows a poor positive correlation between the proportion of French and labor force participation rate among population between the ages 30 and 34 in the United States with a correlation coefficient (R) of 0.143 and weighted average of 84.4%. Similarly, the statistical analysis conducted on geographies consisting of 178,425,767 people shows a mild negative correlation between the proportion of Creek and labor force participation rate among population between the ages 30 and 34 in the United States with a correlation coefficient (R) of -0.326 and weighted average of 80.4%, a difference of 5.0%.
In Labor Force | Age 30-34 Correlation Summary
| Measurement | French | Creek |
| Minimum | 42.2% | 25.0% |
| Maximum | 100.0% | 100.0% |
| Range | 57.8% | 75.0% |
| Mean | 84.1% | 76.2% |
| Median | 84.5% | 78.2% |
| Interquartile 25% (IQ1) | 81.9% | 70.7% |
| Interquartile 75% (IQ3) | 86.2% | 83.1% |
| Interquartile Range (IQR) | 4.3% | 12.4% |
| Standard Deviation (Sample) | 10.0% | 13.7% |
| Standard Deviation (Population) | 9.9% | 13.6% |
Similar Demographics by In Labor Force | Age 30-34
Demographics Similar to French by In Labor Force | Age 30-34
In terms of in labor force | age 30-34, the demographic groups most similar to French are Ecuadorian (84.4%, a difference of 0.010%), Canadian (84.4%, a difference of 0.020%), Lebanese (84.4%, a difference of 0.050%), Trinidadian and Tobagonian (84.5%, a difference of 0.060%), and Immigrants from West Indies (84.5%, a difference of 0.060%).
| Demographics | Rating | Rank | In Labor Force | Age 30-34 |
| Dutch | 20.2 /100 | #198 | Fair 84.5% |
| Immigrants | Thailand | 19.1 /100 | #199 | Poor 84.5% |
| Sub-Saharan Africans | 19.0 /100 | #200 | Poor 84.5% |
| Trinidadians and Tobagonians | 18.2 /100 | #201 | Poor 84.5% |
| Immigrants | West Indies | 18.1 /100 | #202 | Poor 84.5% |
| Canadians | 15.4 /100 | #203 | Poor 84.4% |
| Ecuadorians | 14.2 /100 | #204 | Poor 84.4% |
| French | 13.8 /100 | #205 | Poor 84.4% |
| Lebanese | 10.6 /100 | #206 | Poor 84.4% |
| Bangladeshis | 9.4 /100 | #207 | Tragic 84.3% |
| Arabs | 8.9 /100 | #208 | Tragic 84.3% |
| Jamaicans | 8.8 /100 | #209 | Tragic 84.3% |
| Indonesians | 8.8 /100 | #210 | Tragic 84.3% |
| Japanese | 8.8 /100 | #211 | Tragic 84.3% |
| Immigrants | Western Asia | 8.2 /100 | #212 | Tragic 84.3% |
Demographics Similar to Creek by In Labor Force | Age 30-34
In terms of in labor force | age 30-34, the demographic groups most similar to Creek are Sioux (80.4%, a difference of 0.010%), Pueblo (80.0%, a difference of 0.40%), Colville (80.7%, a difference of 0.41%), Houma (79.9%, a difference of 0.58%), and Seminole (80.8%, a difference of 0.60%).
| Demographics | Rating | Rank | In Labor Force | Age 30-34 |
| Puerto Ricans | 0.0 /100 | #322 | Tragic 81.2% |
| Paiute | 0.0 /100 | #323 | Tragic 81.2% |
| Cheyenne | 0.0 /100 | #324 | Tragic 81.1% |
| Dutch West Indians | 0.0 /100 | #325 | Tragic 81.0% |
| Seminole | 0.0 /100 | #326 | Tragic 80.8% |
| Colville | 0.0 /100 | #327 | Tragic 80.7% |
| Sioux | 0.0 /100 | #328 | Tragic 80.4% |
| Creek | 0.0 /100 | #329 | Tragic 80.4% |
| Pueblo | 0.0 /100 | #330 | Tragic 80.0% |
| Houma | 0.0 /100 | #331 | Tragic 79.9% |
| Kiowa | 0.0 /100 | #332 | Tragic 79.8% |
| Inupiat | 0.0 /100 | #333 | Tragic 79.7% |
| Hopi | 0.0 /100 | #334 | Tragic 79.3% |
| Marshallese | 0.0 /100 | #335 | Tragic 79.2% |
| Natives/Alaskans | 0.0 /100 | #336 | Tragic 79.2% |